Summary
Global central banks, particularly in emerging markets, are steadily increasing gold reserves to diversify away from the US dollar and guard against geopolitical shocks. Notable buyers like China and Poland (+90 tons in 2024) highlight gold’s renewed role as a core reserve asset, creating a strong demand floor. Institutional investors are following suit, using gold as a hedge against inflation, geopolitical risks, and weak traditional assets. Persistently low or negative real interest rates lower the cost of holding non-yielding gold, reinforcing its appeal as a portfolio diversifier and signalling a strategic shift toward gold in global monetary policy.
Demand Drivers
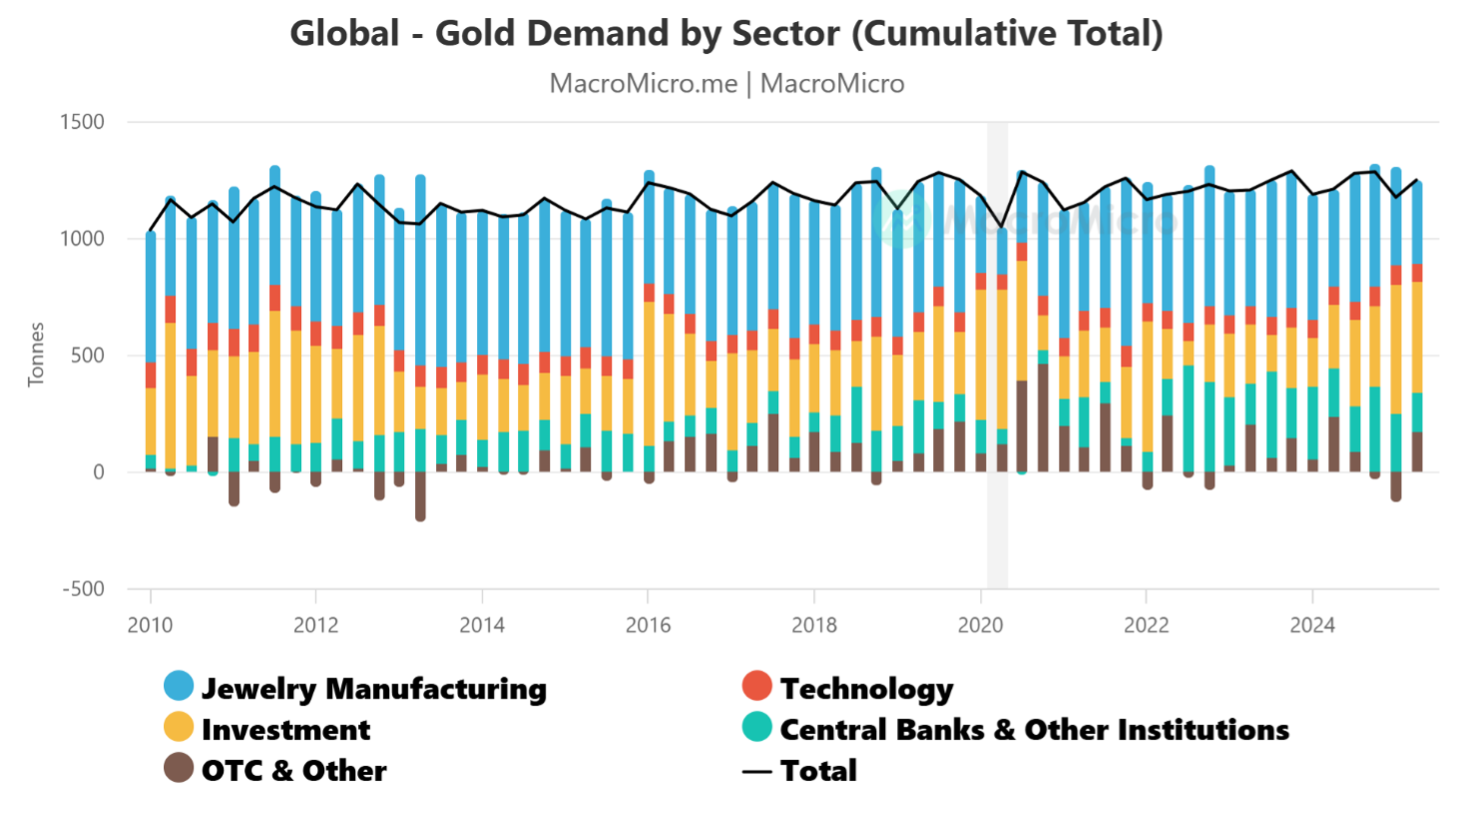
Gold demand is multifaceted, driven by a range of sectors that reflect both cultural traditions and modern economic dynamics. The five primary categories of gold consumption are jewellery manufacturing, technology and industry, investment, central banks and institutional demand, and the over-the-counter (OTC) market.
Jewellery Manufacturing remains the dominant force in gold consumption, accounting for approximately 30% to 50% of total demand. This segment involves converting raw or recycled gold into semi-finished or finished jewellery. It excludes second-hand purchases, gold-plated items, and ornamental coins or bars. China and India are the largest consumers in this category, driven by cultural and ceremonial significance. Despite its size, fluctuations in jewellery demand typically have a limited impact on gold prices due to its relatively stable nature.
Technology and Industry represent a smaller share of gold demand, roughly 5% to 10%. Gold’s exceptional conductivity, malleability, and resistance to corrosion make it indispensable in electronics, dentistry, medical devices, and decorative applications. Electronics alone account for 70% to 80% of this category. However, as gold prices rise, manufacturers often reduce usage or seek alternatives, making this segment sensitive to price volatility but not a major driver of overall demand.
Investment Demand includes both physical and virtual gold. Physical gold comprises bars (usually under one kilogram and at least 99.5% pure), official coins, and medals. Virtual gold includes financial instruments like futures contracts, exchange-traded funds (ETFs), and other derivatives. Together, these forms of investment make up 20% to 30% of total demand. This segment is highly responsive to macroeconomic conditions, inflation expectations, and geopolitical uncertainty, often influencing price movements more directly than other categories.
Central Banks and Institutional Demand have evolved significantly over time. During the Bretton Woods era, central banks were major net buyers of gold. However, after the system collapsed, declining gold prices and better-performing assets led to reduced gold holdings. Between 1989 and 2009, global reserves fell by about 20%. Post-2010, central banks resumed net purchases, and their demand now accounts for 20% to 30% of total consumption. This renewed interest reflects gold’s role as a hedge against currency risk and economic instability.
OTC Market and Other Demands involve direct transactions between buyers and sellers outside centralized exchanges. Participants include gold suppliers and large financial institutions. OTC demand is highly variable, ranging from 0% to 30% of total gold demand. London dominates this market, hosting over half of global gold trading volume. The London Bullion Market Association (LBMA) sets the global benchmark price for gold twice daily, influencing pricing across all segments.
Latest Q2 2025 Data:
- Jewellery Manufacturing: 356.70 to 425.41 tonnes
- Technology: 78.60 to 80.40 tonnes
- Investment: 477.20 to 551.24 tonnes
- Central Banks & Institutions: 166.46 to 248.57 tonnes
- OTC & Other: 169.80 tonnes (latest figure incomplete)
These figures highlight investment and jewellery as the leading drivers of gold demand, with central banks showing
Exhibit 1: Gold Demand
Central Bank Purchases – A Structural Tailwind
A powerful, structural tailwind for gold comes from consistent net purchases by global central banks, especially within emerging markets seeking to diversify reserves beyond the US dollar and insulate against geopolitical shocks. Steady accumulation by countries like China and notable increases elsewhere (e.g., Poland’s +90 tons in 2024) underscore gold’s re-emerging role as a core reserve asset, providing a solid demand floor.
Institutional investors are increasingly adopting this view, allocating strategically to gold as a vital hedge against persistent inflation, geopolitical flare-ups, and potential weakness in traditional financial assets. This shift is driven by factors like low or negative real interest rates, which reduce the opportunity cost of holding non-yielding gold, making it a compelling diversifier in current portfolios
The chart depicting quarterly net gold purchases by central banks globally reflects a significant shift in monetary strategy over time. Gold, long valued for its stability and intrinsic worth, has re-emerged as a cornerstone of reserve asset portfolios, particularly in the wake of economic uncertainty.
Central banks prioritise security and liquidity when selecting reserve assets, and gold offers both. Its role as a hedge against recession is well-established; during periods of market instability, gold tends to perform strongly, preserving value when other assets falter. Additionally, gold serves as an inflation hedge, typically moving inversely to the U.S. dollar. When the dollar weakens, gold prices rise, helping central banks protect purchasing power. Though not the primary motive, return on investment also factors into reserve decisions—gold has delivered an average annual return of around 10% over the past two decades, rivalling U.S. stock market performance and surpassing many other asset classes.
Historically, central banks were net buyers of gold during the Bretton Woods era (1940s–1970s), when gold played a formal role in currency valuation. However, after the collapse of that system, from the 1990s to the early 2010s, central banks shifted to net selling. This was driven by declining gold prices, the rise of more lucrative financial instruments, and strong global economic growth. Gold’s appeal waned as central banks diversified into higher-yielding assets.
The 2008 financial crisis marked a turning point. With heightened concerns over liquidity, systemic risk, and currency volatility, central banks began to rebuild gold reserves, recognising its enduring value in turbulent times. This renewed accumulation trend has continued into the 2020s, with many institutions increasing their holdings to bolster financial resilience.
By 2020, gold comprised roughly 20% of total reserves in developed economies, and 10% in emerging markets. This disparity reflects differing levels of economic maturity, risk tolerance, and access to alternative reserve assets. Nonetheless, the upward trend in gold accumulation is evident across both groups.
The chart’s quarterly data, measured in ounces, underscores the cyclical nature of gold buying, often influenced by macroeconomic developments, geopolitical tensions, and shifts in monetary policy. As global uncertainties persist, central banks are likely to maintain or even expand their gold holdings, reinforcing their status as a strategic reserve asset.
Exhibit 2: Central Bank Purchases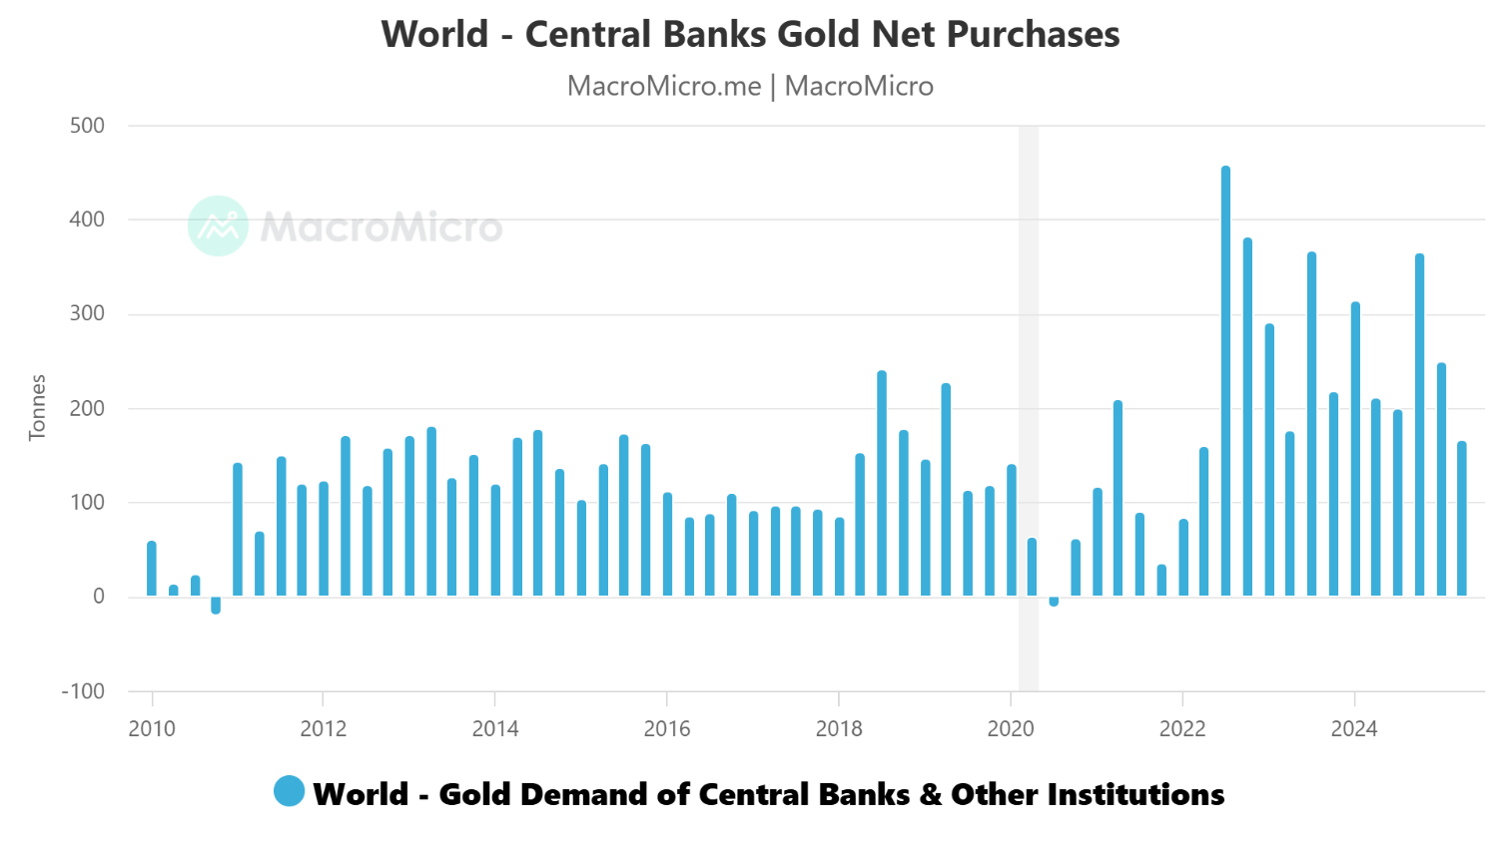
ETF Demand – A Structural Tailwind
The chart tracks weekly net flows of global gold Exchange-Traded Funds (ETFs), segmented by North America, Europe, Asia, and other regions. ETF net flows reflect the movement of capital into or out of gold ETFs, driven by the creation and redemption processes. Creation occurs when securities dealers deliver a basket of assets to the ETF issuer in exchange for ETF shares, expanding the fund and generating inflows. Redemption happens when ETF shares are returned for the underlying assets, shrinking the fund and causing outflows.
Gold ETF activity is most pronounced in North America and Europe, where investor sentiment tends to be more volatile and responsive to macroeconomic conditions. These regions dominate global ETF flows, often reacting swiftly to changes in inflation expectations, interest rates, and geopolitical developments. In contrast, Asia’s ETF flows are relatively stable, though occasional spikes do occur, typically triggered by sudden market disruptions or regional tensions. The “Other Regions” category contributes modestly to global flows.
Latest Weekly Data (as of 2025-09-12):
- North America: Net inflows of 2.84 tonnes, with a cumulative flow of 25.76 tonnes
- Europe: Net inflows of 7.88 tonnes, totaling 13.28 tonnes
- Asia: Net inflows of 3.50 tonnes, but a negative cumulative flow of -1.82 tonnes
- Other Regions: Modest inflow of 0.72 tonnes
These figures highlight Europe’s strong weekly demand and North America’s sustained accumulation. Asia’s mixed performance suggests short-term buying amid longer-term outflows. Overall, ETF flows serve as a key indicator of investor appetite for gold, reflecting broader economic sentiment and regional market behaviour.
Exhibit 3: ETF Flow By Region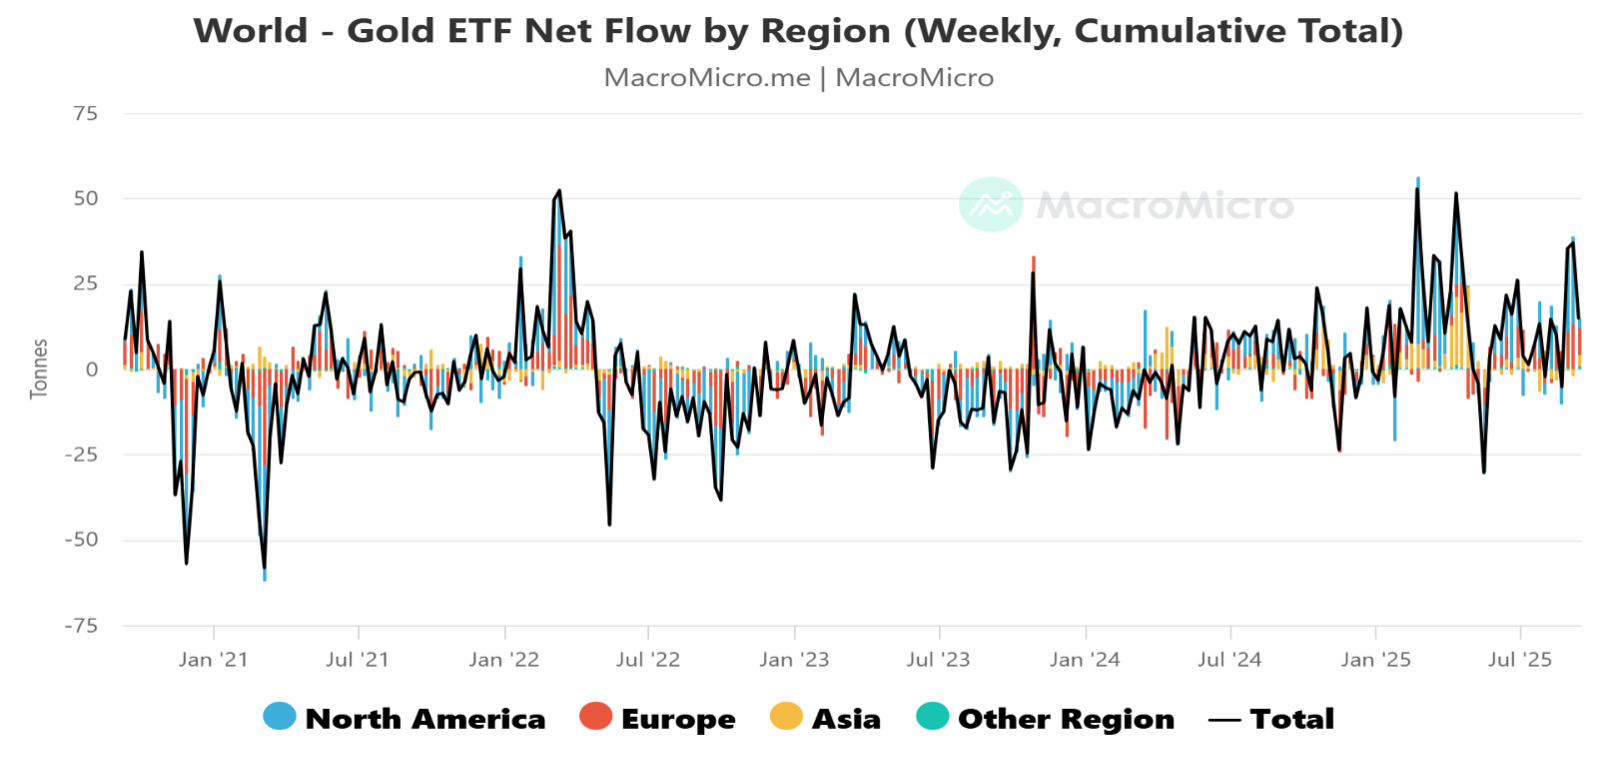
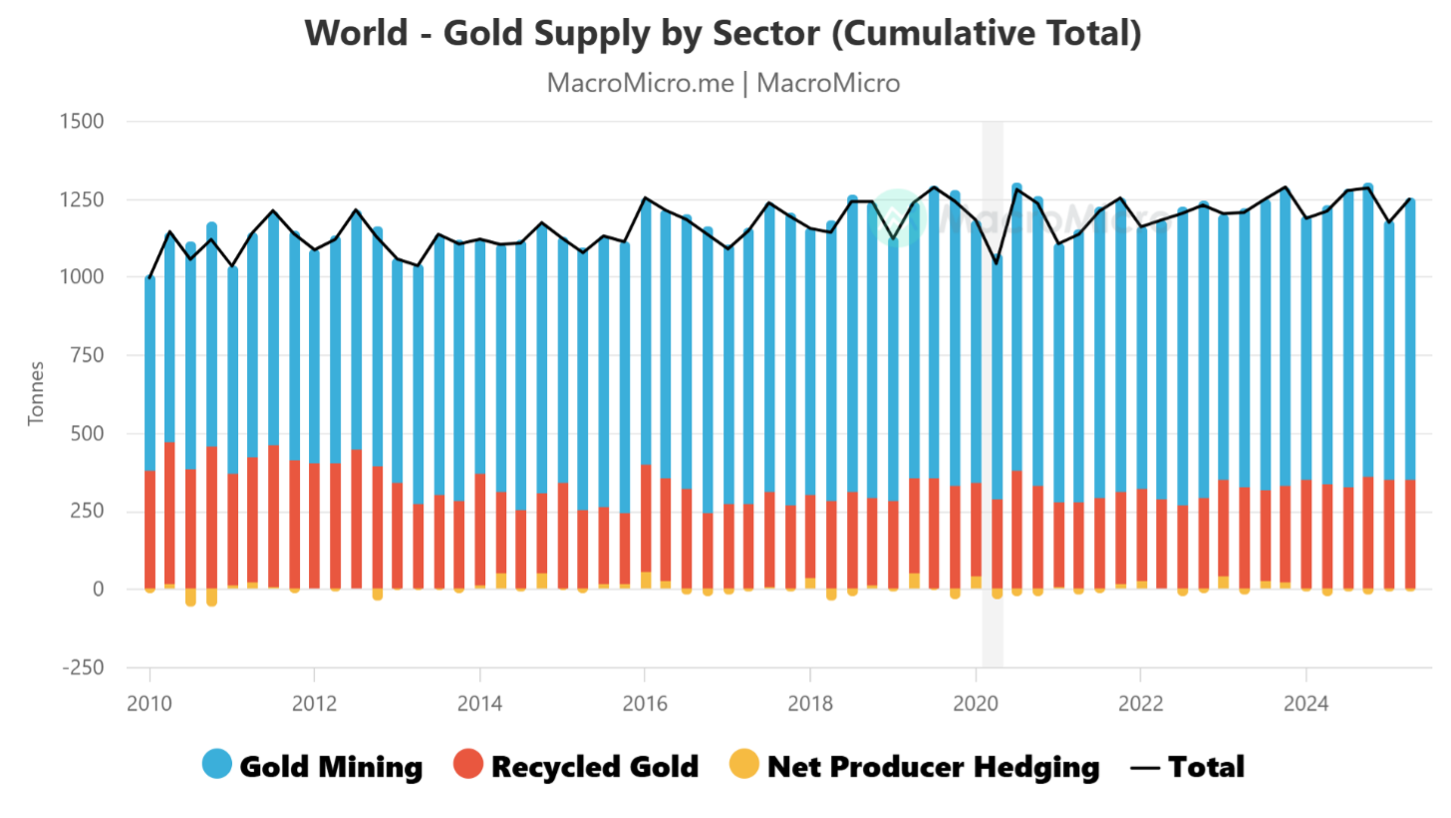
Gold Supply by Sector
Global gold supply primarily comes from mining and recycling, which account for roughly 70% and 30% of total output, respectively, while producer net hedging contributes less than 1%. Mining remains the dominant source, led by China, Russia, and Australia. Production has risen substantially over the past two decades, supported by higher gold prices that incentivize output. However, future growth is constrained by declining discoveries of new deposits and the long lead times—often decades—between exploration and production. As a result, mining responds slowly to price changes despite relatively stable current supply levels.
Recycled gold provides a flexible, price-sensitive source of supply. About 90% comes from jewellery recycling, with the remainder from industrial sources such as discarded electronics. Recycling tends to surge during periods of economic stress or sharp price increases, as seen during the 1997 Asian financial crisis and the 2008 global financial crisis, when consumers liquidated gold to raise cash.
Producer net hedging, once a meaningful source of supply, now plays a negligible role. Mining companies occasionally use forward contracts or options to lock in prices, releasing gold from inventories when initiating hedges and reducing supply when unwinding them. However, since the mid-2000s, hedging activity has declined sharply.
Recent data for Q2 2025 illustrates these dynamics: mined gold supply reached 908.59 tonnes, slightly up from 833.01 tonnes in the prior quarter, while recycled gold supply edged down to 347.23 tonnes from 348.54 tonnes. Producer net hedging registered a small negative contribution of –7.06 tonnes, reflecting continued minimal activity.
Overall, gold supply remains relatively stable, with mining constrained by structural limits and recycling acting as the primary short-term adjustment mechanism. This balance underscores the importance of price movements and economic conditions in shaping available gold flows to the global market.
Exhibit 4: Gold Supply