
Summary:
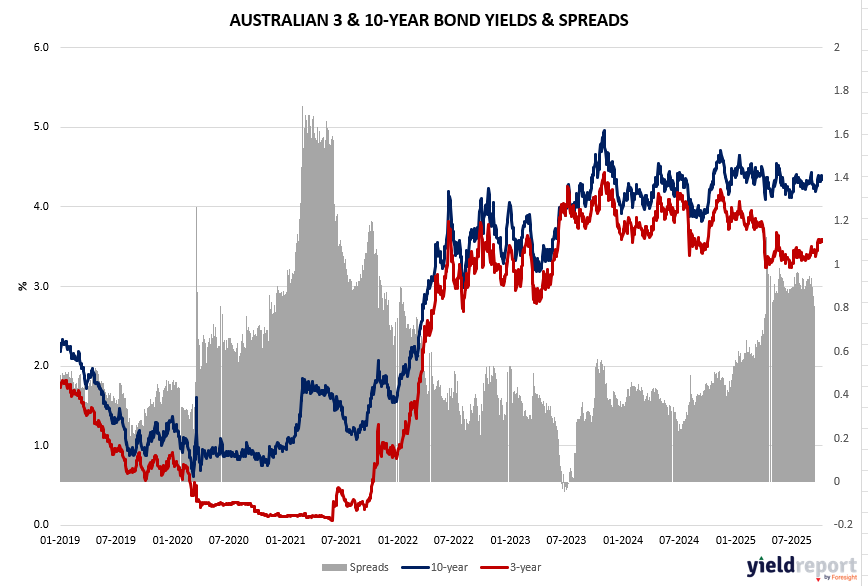
Australian 3-Year & 10-Year Bond Yields and Spread
- Trend Overview: From mid-2019 to early 2025, both the 3-year and 10-year yields have generally trended upward, reflecting tightening monetary conditions and inflationary pressures.
- Spread Behavior: The spread between the 10-year and 3-year yields has remained mostly positive, fluctuating between 0.2% and 1.6%. This suggests a normal yield curve, indicating investor expectations of long-term growth and moderate inflation.
- Recent Movement: In late 2024 and early 2025, the spread narrows slightly, hinting at a potential shift in sentiment—possibly due to expectations of rate cuts or slowing economic momentum.
Figure 1: Australia 3 and 10-year Bond Yield Spread
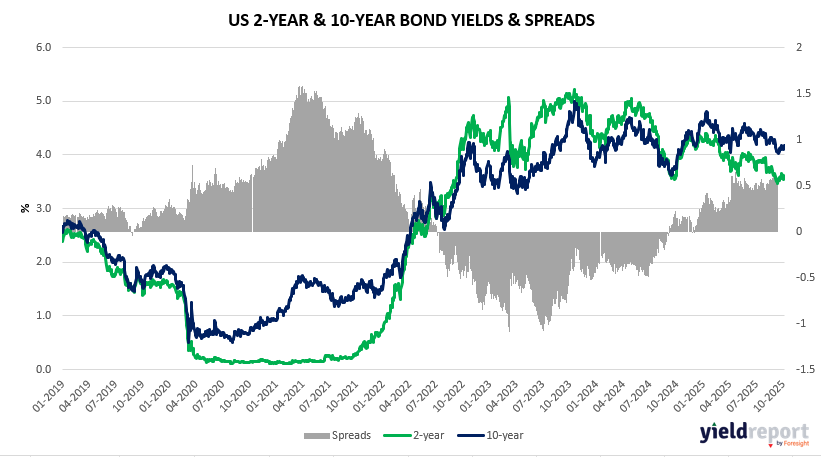
U.S. 2-Year & 10-Year Bond Yields and Spread
- Trend Overview: From 2019 to mid-2023, both yields rose sharply, especially the 2-year yield, driven by aggressive Fed rate hikes.
- Inversion Signal: The spread turned negative around mid-2022 and remained inverted through 2023, with the 2-year yield exceeding the 10-year yield by up to 1.5%. This yield curve inversion is a classic recession signal, reflecting short-term rate pressures and long-term growth concerns.
- Market Implication: The persistent inversion underscores investor anxiety about economic slowdown, aligning with tightening credit conditions and softening macro indicators.
Figure 2: US 2 and 10-year Bond Spread
Strategic Takeaways
- Australia: The curve remains upward-sloping, suggesting resilience and a more measured policy stance. Investors may interpret this as a signal of stable long-term growth expectations.
- United States: The inversion is more pronounced and prolonged, reinforcing recessionary concerns and a potential pivot in Fed policy.
To learn more about yield curves and their predictive power, visit this article or this one.