JCB find the YieldReport to be an invaluable summary of all debt market activity. Whilst we are focussed on the highest grade bonds it is important to see what is..Angus Coote, Executive Director, JCB Active Bond Fund
Interest Rate & Market Commentary for Week Ending 21st November 2025
Weekly Overview
The NASDAQ sustained its third consecutive weekly decline as doubts resurfaced about the resilience of this year’s AI-fuelled market rally. The index finished the week down 2.7%; with more modest weightings in tech stocks, the S&P 500 and the Dow posted smaller declines of just under 2.0%.
A gauge that tracks investors’ short-term expectations of U.S. stock market volatility surged, accelerating a rise that began the previous week. The CBOE Volatility Index climbed as high as 28 in trading on Thursday before pulling back to close around 23 on Friday. The figure was up from the prior week’s closing VIX level of just below 20.
As earnings season wrapped up, FactSet reported that the overall net profit margin for America’s largest companies rose to the highest level since the research firm began collecting margin data in 2009. Companies in the S&P 500 reported an average third-quarter margin of 13.1%, above the previous record of 13.0% set in the second quarter of 2021. The margin has now increased for seven quarters in a row.
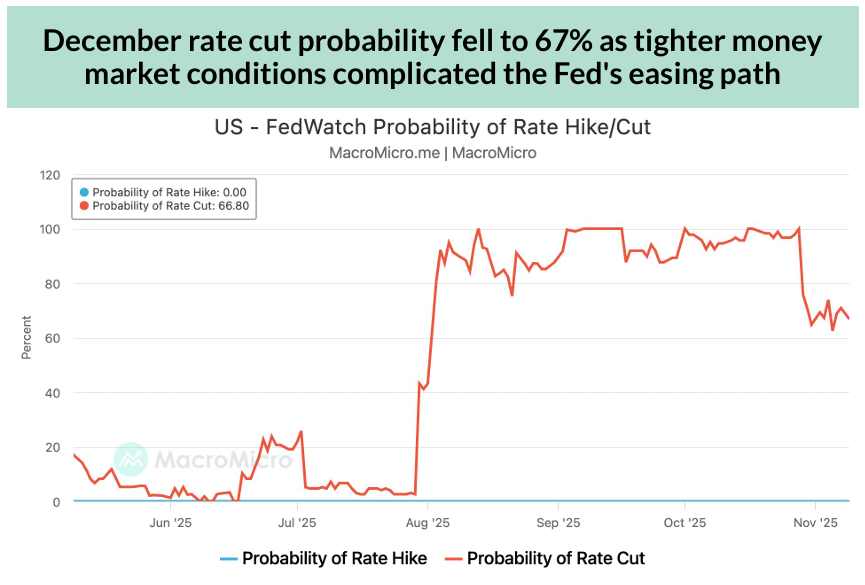
Shifts in the outlook for an interest rate cut at the next U.S. Federal Reserve meeting fuelled market volatility. Friday afternoon’s prices in rate futures markets implied a nearly 72% probability that the Fed would cut by a quarter point at its meeting concluding December 10, according to CME FedWatch. Just two days earlier, traders had been pricing in a roughly 30% likelihood of a December cut.
Yields of U.S. government fell on Friday after a speech by one of the U.S. Federal Reserve’s voting members lifted investor expectations for a rate cut at the Fed’s meeting concluding on December 10. The yield of the 10-year U.S. Treasury finished at 4.06%, down from 4.15% at the end of the previous week.
A long-delayed jobs report issued on Thursday showed that recent labour market weakness eased in September, before the government shutdown. The U.S. economy generated 119,000 new jobs, more than double the figure that most economists had forecast. However, unemployment rose to 4.4%, the highest since October 2021.
The backlog of U.S. economic data resulting from the recent government shutdown continued to leave investors and policymakers guessing ahead of the Thanksgiving holiday, which will further disrupt the release schedule. The unemployment rate and the Consumer Price Index for October won’t be released because data couldn’t be collected. The government also hasn’t issued a third-quarter GDP estimate.
A week after falling into a bear market, the price of the most widely traded cryptocurrency fell further, sinking to the lowest level in seven months. Bitcoin was trading around $85,000 on Friday afternoon, down from its record price of about $125,000 reached in early October.
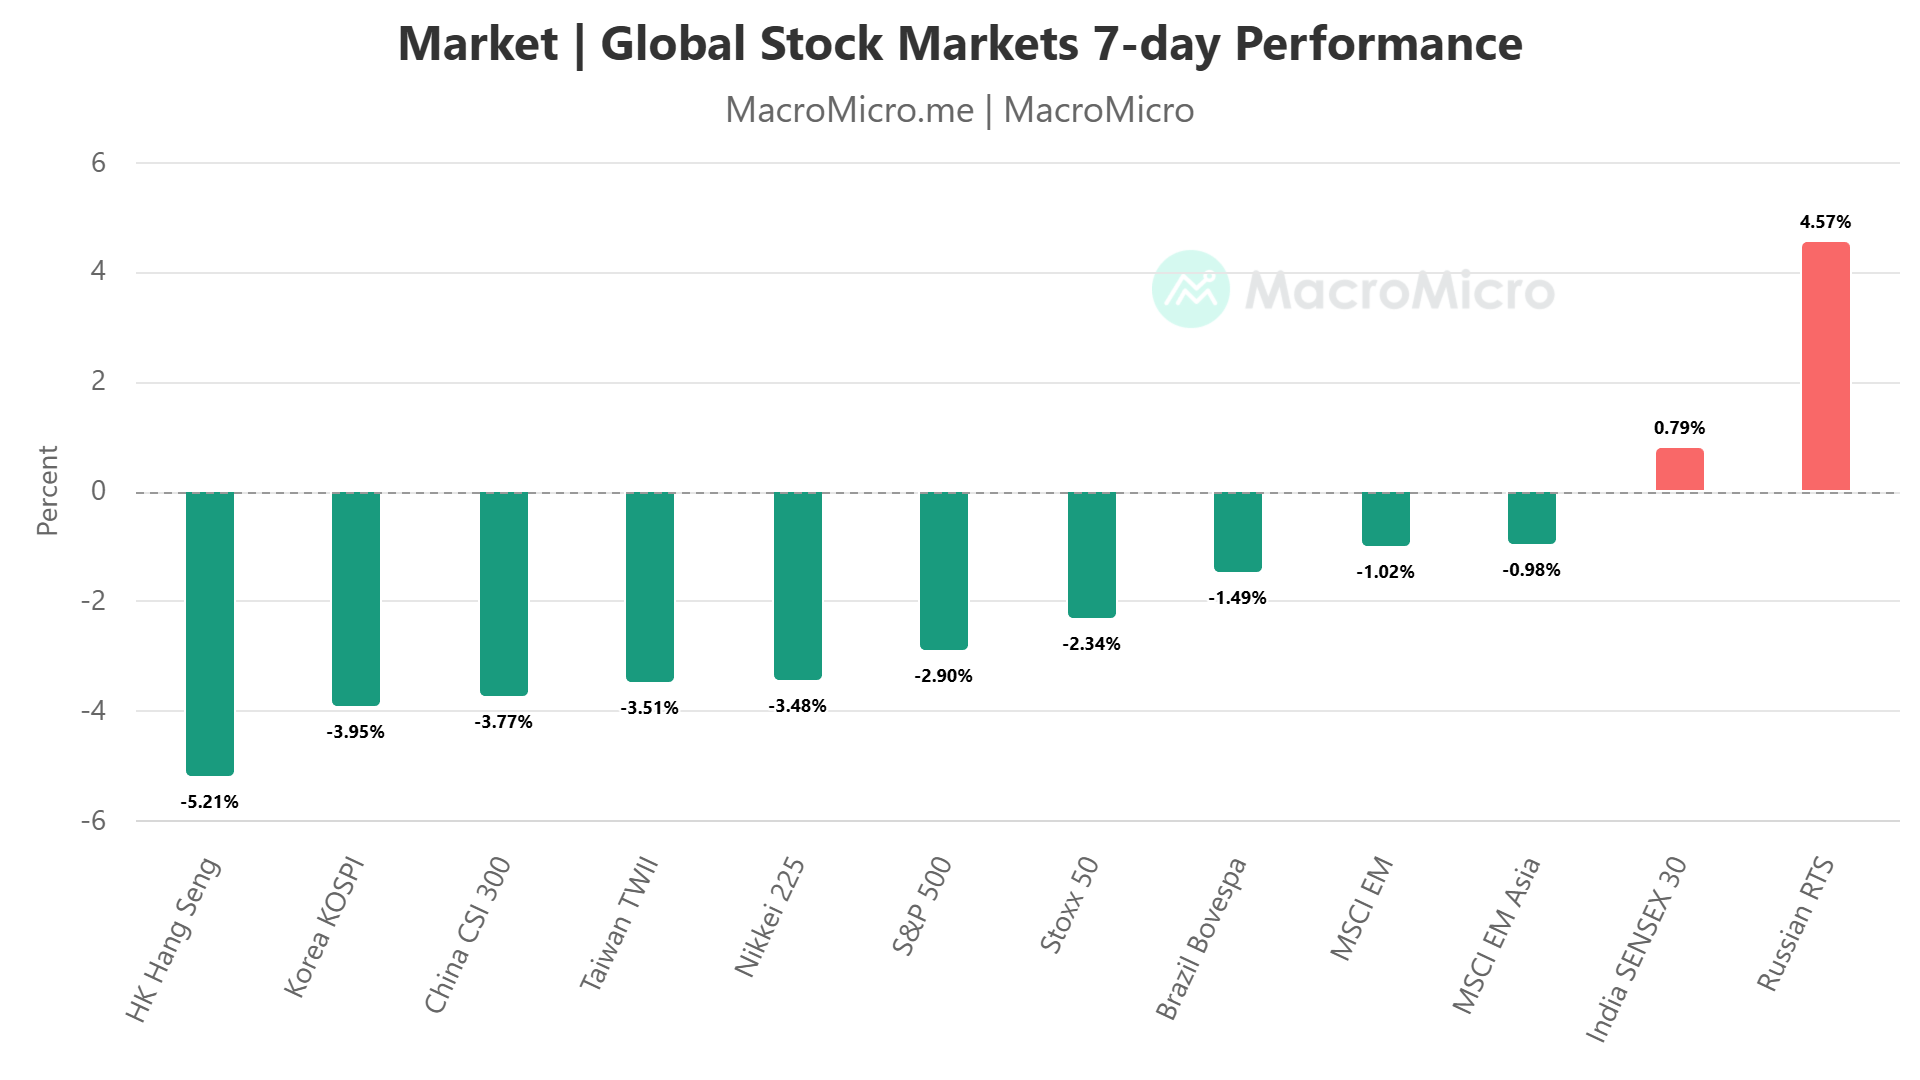
Figure 1: World –: World – Major Stock Indices 7 Day Return
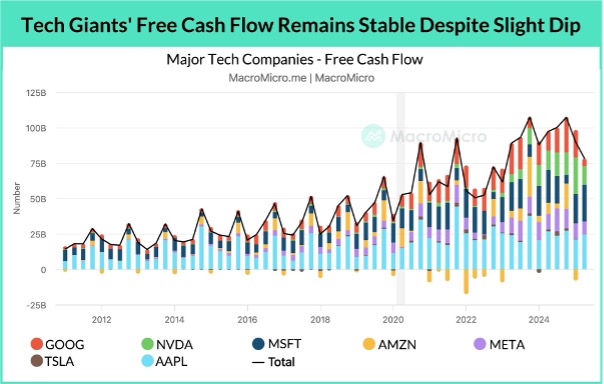
Chart of the week: Show me the Cash’ – Mag-7 Free Cashflow
Despite massive investment, the Magnificent 7 still generate robust and generally rising FCF thanks to strong underlying businesses and healthy balance sheets. Since 2023, aggregate FCF has trended upward, and Q3 2025 cloud revenue growth for Google, Amazon, and Microsoft remained solid at 20–30%. However, in the past two quarters, the Magnificent 7’s free cash flow has declined for two consecutive quarters, pressured by surging capex. This makes it increasingly important to determine whether these investments will convert into future revenue.
Market Summary Table
Name
Week Close
Week Change
Week High
Week Low
Cash Rate%
3.60%
3m BBSW %
3.64
0.00
3.65
3.64
Aust 3y Bond %*
3.76
0.00
3.78
3.72
Aust 10y Bond %*
4.47
0.03
4.48
4.42
Aust 30y Bond %*
5.10
0.07
5.08
5.03
US 2y Bond %
3.54
-0.05
3.61
3.54
US 10y Bond %
4.08
-0.05
4.13
4.08
US 30y Bond %
4.72
-0.02
4.75
4.72
$1AUD/US¢
64.49
-0.78
65.35
64.37
Global Themes Shaping Markets
Investors continue to worry whether the explosive growth in AI-related equities, particularly NVIDIA, signals sustainable technological progress or the formation of an AI bubble. Although NVIDIA’s Q3 FY2026 (2025 Q3) earnings again shattered records with US$57 billion in revenue (+62.5% YoY), we highlight several emerging risks behind the headline numbers, including rising inventory turnover days (103 vs 91) and slowing growth in end-user AI applications such as automotive and robotics. We frame these issues through three core risk areas – capital expenditure risks, valuation risks, and market concentration risks and present a few financial indicators investors should monitor.
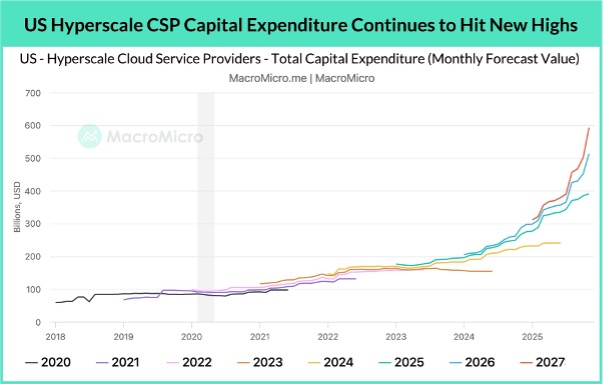
AI infrastructure requires enormous upfront spending, especially from hyperscale cloud providers like Microsoft, Amazon, Google, Meta, and Oracle. To meet demand for AI compute, these firms are collectively expected to spend ~US$400 billion in 2025, rising to US$518 billion in 2026, with total 2025–2030 investment potentially reaching US$3 trillion. This “spend first, monetize later” model increases financial leverage risk, particularly because much future revenue is locked into long-dated Remaining Performance Obligations (RPOs), amounting to US$700 billion among major CSPs.
Hyperscalers are funding their capex through a mix of strong operating cash flows, significant on-balance-sheet debt issuance, and off-balance-sheet financing structures such as Meta’s US$27 billion Hyperion SPV. Rising leverage increases scrutiny on whether AI investments will convert into sustainable revenue.
Two metrics help evaluate these risks:
Metric 1: Free Cash Flow (FCF) Sustainability
Despite heavy capex, the Magnificent 7 continue to generate strong FCF, supported by resilient cloud revenue growth (20–30%). However, FCF has declined for two consecutive quarters, making it more important to track whether higher capex is driving incremental income or compressing cash reserves.
Metric 2: Capex-to-Revenue Ratio
This ratio highlights whether revenue growth is keeping pace with rising investment. Nearly all hyperscalers’ ratios are increasing, with Oracle’s being the highest. While elevated capex is normal in early technological cycles, persistent divergence between spending and revenue signals long-term cash-flow pressure. Ratios remain below the peaks of the dot-com bubble but bear close monitoring.
Exhibit-2-GSP-by-Industry-–-NSW-National-1.jpg
Valuation Concerns – Where Are the Real Risks?
Although comparisons to the 2000 dot-com bubble are common, we highlight four key differences favouring the current AI cycle:
Technological moat – NVIDIA’s ecosystem (GPUs + CUDA + software + packaging) is far harder to replicate than Cisco’s commodity routers in 2000.
Profitability – NVIDIA’s forward P/E (~30x) is modest compared to Cisco’s (~180x) at the height of the dot-com boom.
Demand nature – Today’s AI demand is structural, supply-constrained, and monetizable, unlike the speculative dot-com overbuild.
Corporate health – Tech giants now possess strong balance sheets and robust cash flows, unlike many unprofitable dot-com IPOs.
The real valuation concern today lies in unprofitable small-cap tech and AI companies, which have seen the steepest corrections.
Exhibit 3: NVIDIA Valuation
Metric 3: The Rule of 40
This measure (revenue growth + profit margin ≥ 40%) identifies financially healthy growth companies. Firms below 40% are most exposed to valuation compression. For example, Palantir scored 114% in Q3 2025, showing exceptional financial performance, while many smaller AI names fall short.
III. Market Concentration Risks – How Dependent Is the Market on AI Leaders?
The top 10 companies now represent 42.19% of S&P 500 market cap, an unprecedented level. Concentration risk is a key concern because a correction in a few mega-caps can drag down the entire index.
Metric 4: Market Cap vs Net Income Contribution
Market concentration is justified when profit concentration rises similarly. Over 15 years, top 10 companies’ profit share has nearly doubled from ~20% to almost 40%, showing fundamentals mostly support their weight in the index.
Metric 5: Inventory Turnover Days – A Supply Chain Indicator
Monitoring inventory days across NVIDIA, TSMC, Broadcom, Micron, Intel and others help determine whether AI demand is diffusing across the broader tech ecosystem. Current data shows improving inventory health across memory, consumer semis, and industrial chips, signs that AI demand is spreading beyond core compute. NVIDIA’s rising inventory days warrant attention but are not yet alarming.
Key Takeaways
We believe that while rising hyperscaler capex, heightened market concentration, and early signs of inventory buildup warrant vigilance, today’s AI cycle is fundamentally stronger than the dot-com era.
Sustainability hinges on whether downstream AI applications continue scaling and monetising effectively.
Continuous monitoring of the five indicators: FCF, capex-to-revenue, Rule of 40, concentration vs profits, and inventory trends, offers a disciplined framework to assess whether an AI bubble is forming or whether the sector remains in a durable growth phase.
Overview of the US Equities Market
Wall Street ended a turbulent week with a broad equity rebound, reversing part of a sharp selloff that had rattled speculative assets and tested investor confidence. Around 450 S&P 500 stocks advanced, lifting the index by 1%, while mega cap volatility remained elevated. Nvidia recovered most of an earlier 4% drop after news that US officials may allow sales of its H200 AI chips to China, easing geopolitical concerns. Sentiment also improved when New York Fed President John Williams signalled that a rate cut remains possible, prompting traders to increase bets on a December move despite divided Federal Reserve commentary.
The week was marked by violent rotations, particularly in crypto and AI-related names that had been favourites among retail and momentum traders. Bitcoin stabilised above $84,000 but was still headed for its worst month since 2022, having shed nearly a quarter of its value amid liquidation-driven turmoil. Despite Friday’s rally, the S&P 500 remained on track for its worst month since March, an unusual outcome given November’s typical strength.
Broader market positioning reset through the week, with over $3.1 trillion in options expiring, amplifying swings. Analysts described the volatility as a “release valve” rather than a structural trend reversal. Williams’ dovish tone helped drive Treasury yields lower, with the 10-year slipping to 4.06% and the dollar wavering. Traders continued to brace for renewed volatility as macro data resumes after the shutdown, with the absence of October CPI and an incomplete jobs report adding to uncertainty.
Some institutional strategists interpreted the selloff as nearing exhaustion. Goldman Sachs’ Tony Pasquariello saw signs of “capitulation,” while Barclays’ Equities Timing Indicator (BETI) fell below –7, a level that historically signals short-term upside in the S&P 500. UBS and Sanctuary Wealth argued that rate cuts, strong earnings, and the AI growth story should support markets into 2026, although technology may pause to digest outsized gains.
Still, concerns around big tech leverage have grown. AI-driven capex spending continues to surge, but unlike earlier years when firms funded investment with cash, companies are now raising record amounts of debt, unnerving equity traders. Bloomberg Intelligence data shows tech giants relying increasingly on bond issuance, SPV structures and layered financing—raising questions about long-term margins and return on invested capital. Analysts warned that diluted free cash flow, high valuations and elevated credit costs increase the burden of proof for tech earnings.
Market strategists noted that parts of the market unrelated to AI have also weakened, pointing to potential stress in private credit or deleveraging in crypto. Bitcoin’s collapse, over 30% from its October peak, echoed past crypto failures and wiped out $1.5 trillion in digital-asset market cap. Technical analysts flagged key supports at $80,000 and $75,000, with near-term consolidation expected.
Corporate news added to the mixed backdrop: Cathie Wood’s ARK bought additional Nvidia shares; Gap posted surprisingly strong sales; Eli Lilly and Novo Nordisk advanced new distribution models for weight-loss drugs; and merger concerns arose around Warner Bros Discovery. Several firms, including Amazon’s Ring and Hon Hai, announced restructuring or expansion plans.
Overall, markets remain caught between two dominant narratives, monetary policy uncertainty and the still-unfolding AI monetisation cycle. While profit-taking and leverage fears weigh on sentiment, most strategists expect fundamentals and easing policy to support equities into 2026.
Overview of the US Treasuries Market and Other Fixed Income Markets
US Treasury markets weakened as expectations for a Federal Reserve rate cut in December diminished sharply following a series of cautious comments from policymakers. As traders reassessed the outlook, the probability of a December cut fell below 50%, compared with near-full pricing only a month earlier. Previously, markets had assumed that labour-market softness would outweigh lingering inflation pressures, but Fed officials have since emphasised the need to keep policy “somewhat restrictive” as inflation remains above target.
Yields rose two to three basis points across the curve, led by the 30-year Treasury, which sold off after a $25 billion auction cleared at 4.694%, above pre-auction levels and signalling soft investor demand. The US dollar weakened for the sixth time in seven sessions, while the S&P 500 fell more than 1.5%, marking the first trading day in some time when both equities and bonds declined simultaneously.
Cleveland Fed President Beth Hammack reiterated the need for caution, noting limited visibility due to the 43-day government shutdown, which halted many official economic releases. Other Fed officials, including Mary Daly, Alberto Musalem and Susan Collins, echoed concerns about cutting rates prematurely, reinforcing market doubts about December easing.
With the shutdown ending, volatility indicators such as the ICE BofA MOVE Index have rebounded to one-month highs, reflecting expectations of sharp market swings as official data begins to flow again. Strategists warned that new inflation and employment figures could significantly impact the front end of the curve because markets have not settled on the Fed’s direction.
During the shutdown, investors relied heavily on private-sector data, including ADP’s employment figures, which suggested a softening labour market. Still, the release of key federal reports is delayed or incomplete: the October jobs report will not include an unemployment rate, and the CPI report is unlikely to be published.
Treasury markets remained in a holding pattern, with the 10-year yield oscillating around 4% and the broader Treasury index posting a modest 0.4% gain, adding to what is shaping up to be the market’s strongest year since 2020. Meanwhile, traders increased options bets on a drop in 10-year yields below 4%, anticipating that incoming data could show deeper economic cooling.
BMO’s Ian Lyngen summarised sentiment: yields will remain range-bound until clearer evidence emerges about the real economy and the Fed’s bias ahead of the December 10 FOMC meeting.
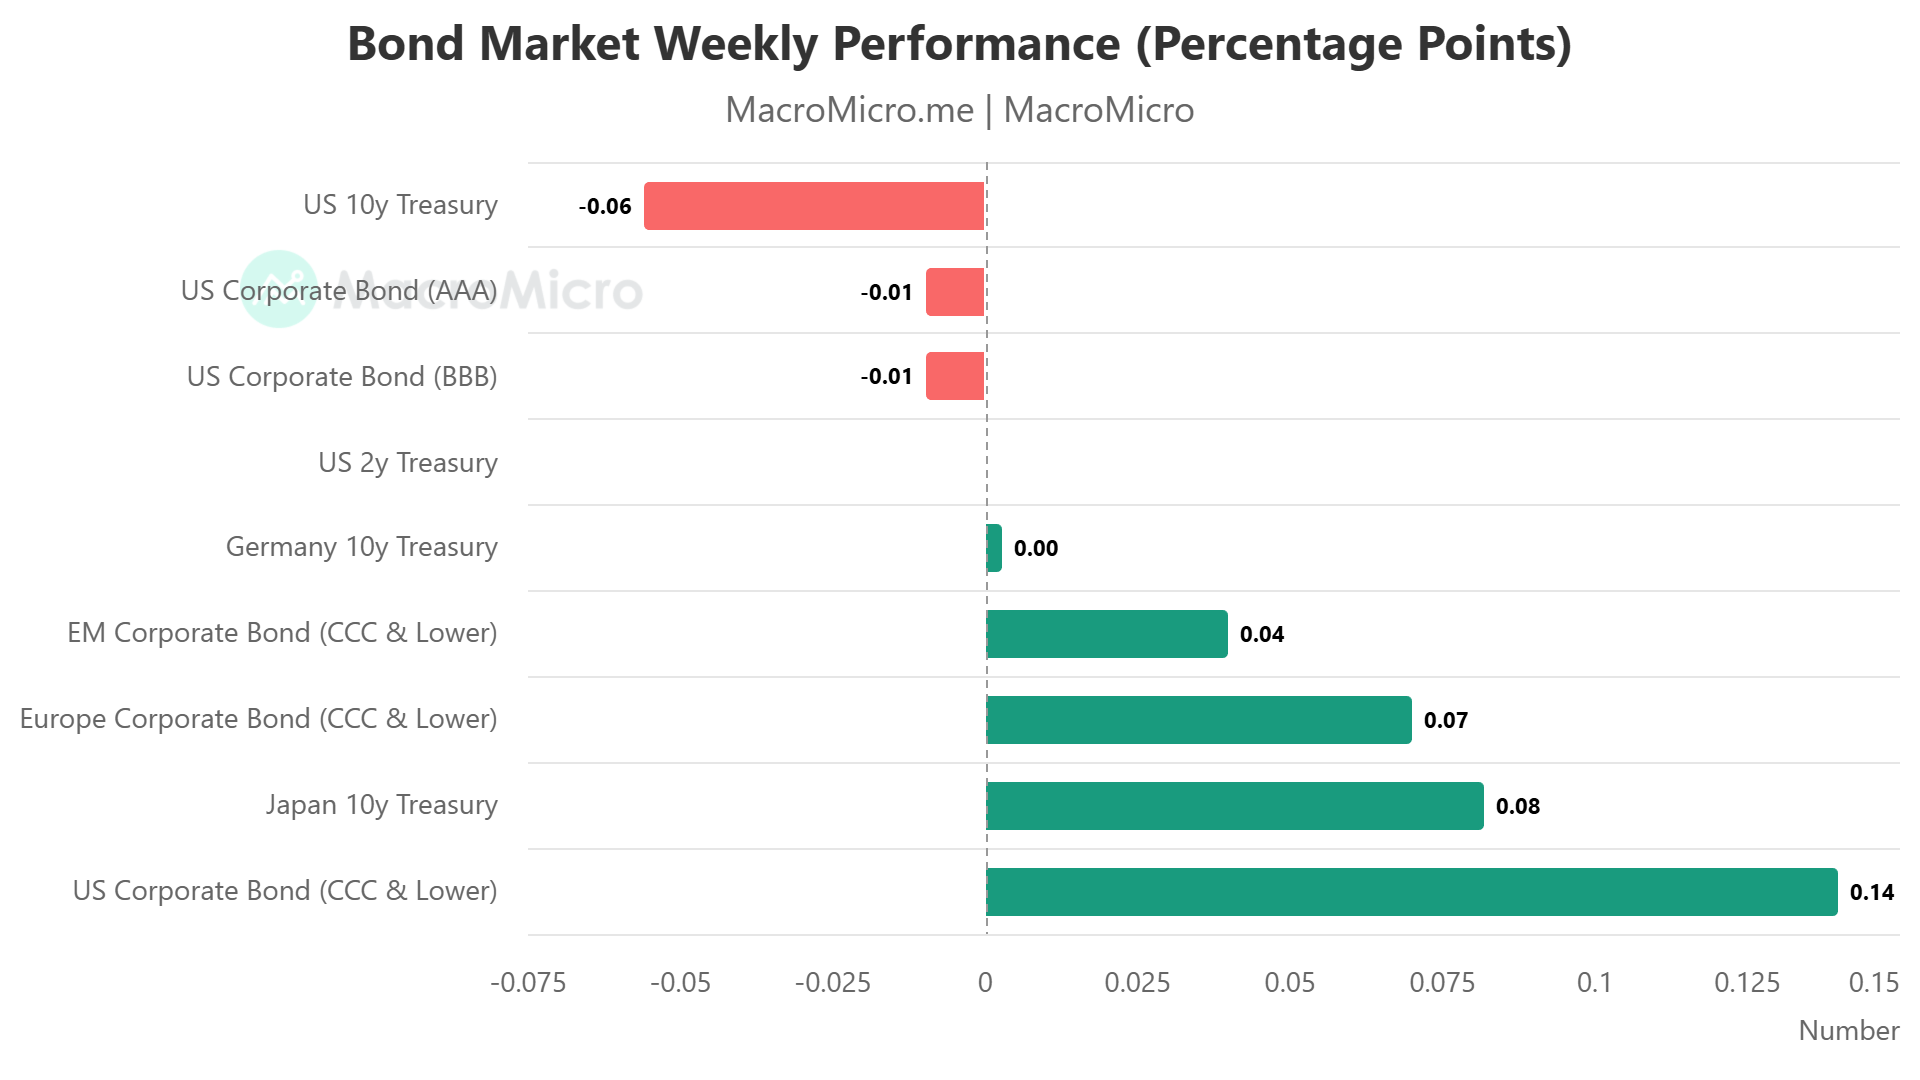
Figure 4: Bond Yield Movements in the Past Week
Overview of the Australian Equities Market
Australian equities extended their decline for a fourth consecutive week, with the S&P/ASX200 sinking 1.59% (-136 points) to 8,416.5, its lowest level since June and more than 7% below its mid-October record high of 9,115. The broader All Ordinaries fell 1.67%. The sell-off was triggered by a strong U.S. jobs report, which weakened expectations of imminent U.S. Federal Reserve rate cuts, sparking a global retreat from risk assets and intensifying concerns around already stretched equity valuations.
Market analysts noted that the Australian market had attempted multiple times to correct in recent weeks but now appears to be entering a deeper and more sustained downturn. All 11 ASX sectors finished in the red, with raw materials leading losses, down nearly 4%, as commodity markets weakened sharply. Higher-for-longer global interest rate expectations weighed on gold, pushing spot prices to US$4,054, which in turn drove heavy selling in gold miners. Broader mining segments also slumped, including mixed miners, rare earths, and lithium producers, as investors tempered their expectations for rapid AI-driven materials demand. Iluka Resources was among the worst performers, tumbling 11%.
The energy sector dropped 3.1%, reflecting easing geopolitical risk premium amid potential Ukraine–Russia peace talks and softer sentiment across the AI-linked uranium space. Coal stocks also declined 2–4% including Whitehaven, Yancoal, and New Hope.
Financials were comparatively resilient but still lower (-0.7%). Commonwealth Bank was the only major bank to close slightly higher (+0.04%), despite its share price remaining more than 12% below early-November levels after an underwhelming Q1 profit update.
Rate-sensitive sectors were notably weak: real estate (-2.0%), consumer discretionary (-1.3%), information technology (-1.0%), and industrials (-1.0%), reflecting rising bond yields and the repricing of monetary policy expectations. Nevertheless, Kogan rose 0.7% despite weaker earnings, while WiseTech rebounded 2.4% following reaffirmed guidance—though its share price remains deeply depressed compared to last year.
Defensive sectors outperformed, with health care and consumer staples holding roughly flat. Ryman Healthcare surged 5.4%, while Mayne Pharma plunged nearly 25% after Treasurer Jim Chalmers blocked its proposed $627m takeover by U.S. firm Cosette on FIRB advice.
Companies holding AGMs included Kogan, Lovisa, Macquarie Technology, Reece, Sims, and WiseTech. Orica traded ex-dividend.
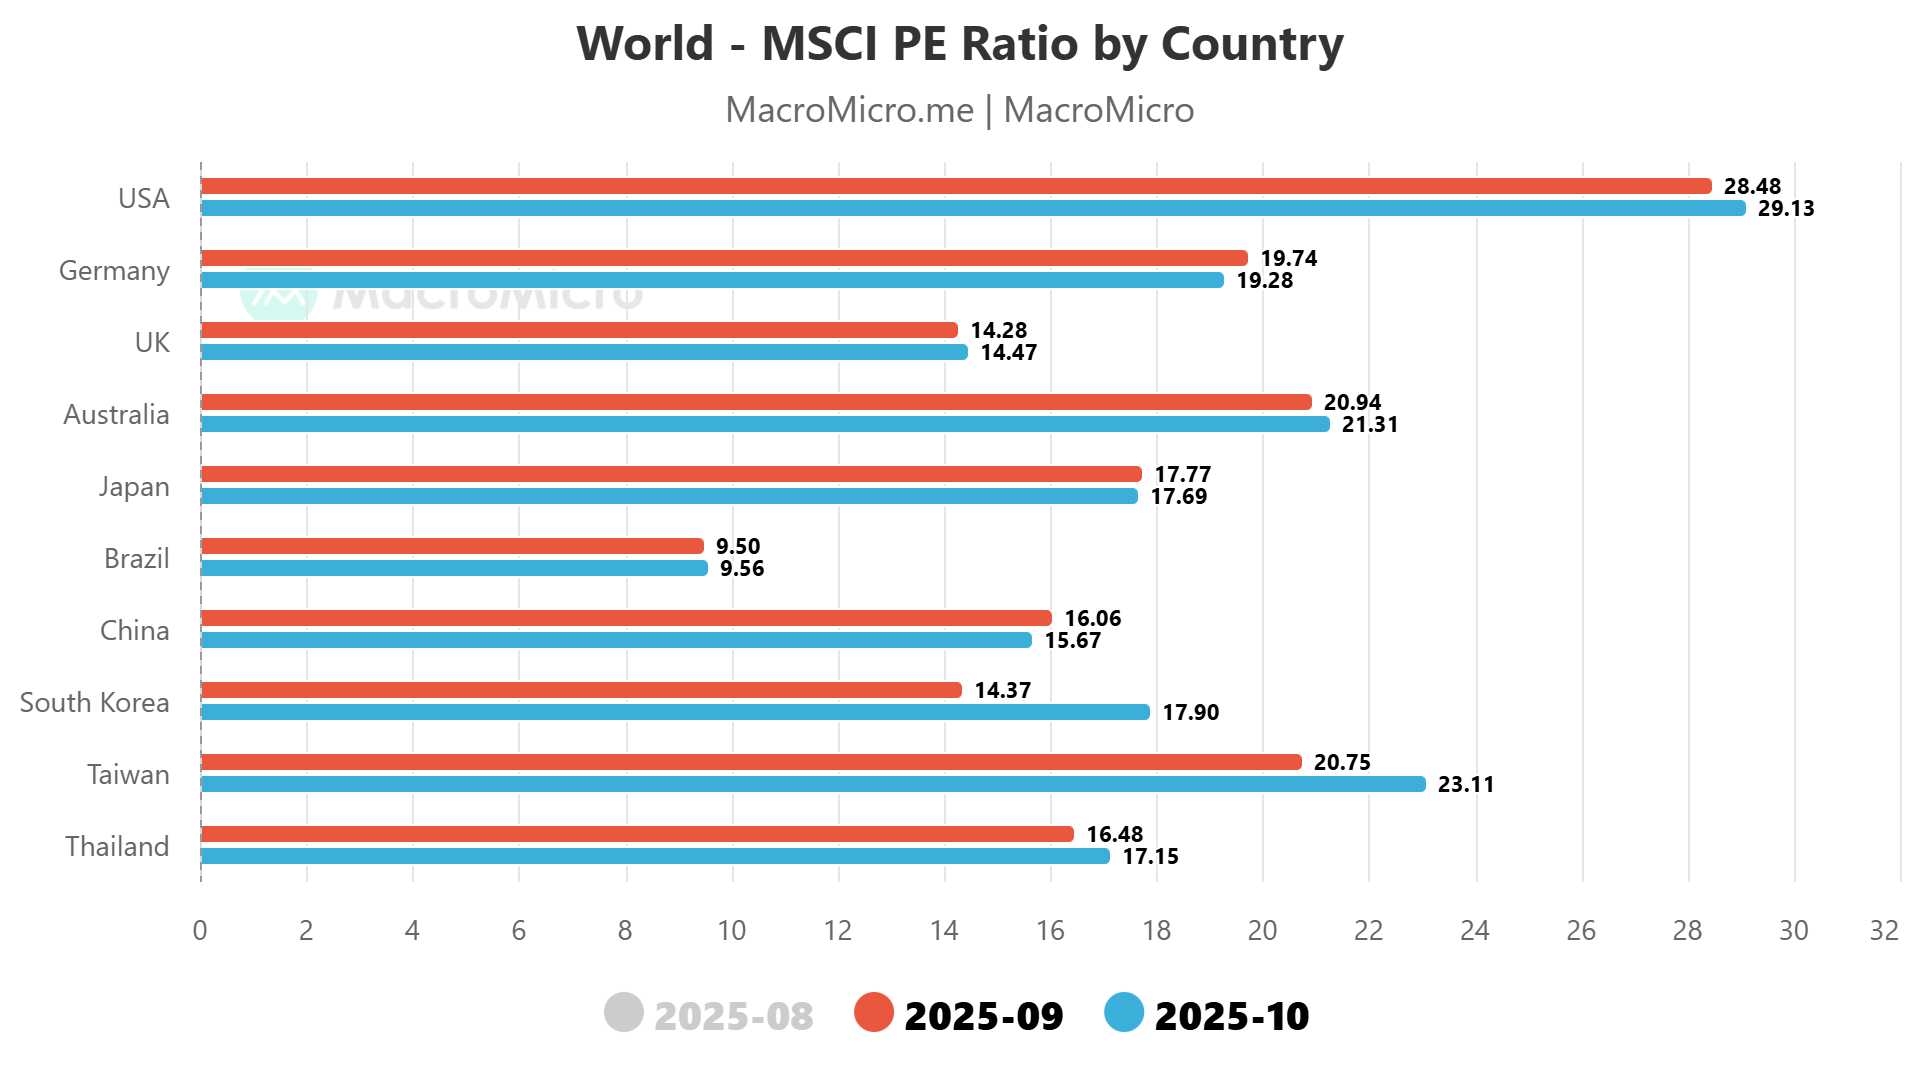
Figure 5– World MSCIPE Ratio by country
Overview of the Australian Government Bond Market
Australia’s annual wage growth remained elevated in the September quarter, highlighting a still-tight labour market and ongoing productivity weakness, key factors complicating the Reserve Bank’s inflation-control efforts. The Wage Price Index rose 3.4% year-on-year and 0.8% quarter-on-quarter, in line with expectations. Notably, public-sector wage growth again outpaced the private sector for the third consecutive quarter, driven largely by state-government pay agreements. Health care and social assistance contributed the most to quarterly wage gains, while sectors such as financial services and media recorded softer outcomes.
Economists warn that the persistence of elevated wage growth signals employers are still struggling to recruit suitably skilled workers, pushing firms to offer higher wages despite weak productivity. These dynamic risks keeping real unit labour costs higher than the RBA anticipated, reinforcing concerns that inflationary pressures may take longer to moderate.
The RBA, which has already cut rates three times this year to 3.6%, remains cautious and data dependent. Governor Michele Bullock has signalled that further easing is unlikely in the near term, especially given still-firm wages, resilient consumer spending, and a labour market near historic tightness. Money-market pricing reflects only a slim chance of another cut in 2026, with most economists expecting easing to resume around May.
The central bank forecasts unemployment rising modestly to 4.4% and wage growth easing to 3%, a level broadly consistent with achieving its 2–3% inflation target amid weak productivity trends.
Australian fixed interest market experienced mixed but generally stable rate movements over the week, with most major yield curves trading in tight ranges despite ongoing macro uncertainty. In Australia, the cash rate remained unchanged at 3.60%, while front-end funding markets were steady: the 3-month BBSW held flat at 3.64%, sitting just 1 basis point below its weekly high. This signals stable short-term liquidity conditions and limited repricing around immediate RBA policy expectations.
Across the Australian sovereign curve, yields drifted slightly higher. The 3-year bond yield closed at 3.76%, unchanged on the week but trading within a narrow 6-point band (3.72%–3.78%). The 10-year yield edged up 3 bps to 4.47%, consistent with modest upward pressure on global long-end rates. The most notable movement was at the ultra-long end, with the 30-year bond rising 7 bps to 5.10%, reflecting a steeper curve and possibly higher term-premium pricing as markets reassess long-run inflation and fiscal dynamics.
In contrast, US Treasury yields eased across the curve following softer data and shifting Federal Reserve expectations. The US 2-year yield fell 5 bps to 3.54%, mirroring reduced near-term rate-cut uncertainty. Longer maturities also slipped: the 10-year fell 5 bps to 4.08%, while the 30-year dipped 2 bps to 4.72%. Despite geopolitical and policy noise, US yields stayed within tight intra-week ranges, suggesting markets are awaiting more definitive macro signals post-shutdown.
Currency markets reflected broad US-dollar strength, with the Australian dollar falling 0.78 US cents to 64.49, trading between 65.35 and 64.37. The weaker AUD aligns with softer risk appetite, higher relative US yields, and ongoing concerns around global growth momentum.
Overall, the week was characterised by slight steepening in Australian yields, marginal easing in US yields, and continued downward pressure on the AUD, reflecting a market still finely balanced between inflation concerns, central-bank signalling and global risk sentiment.
Exhibit 6: Australia 3 and 10-year Bond Yield &Spread
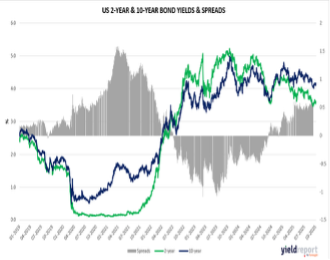
Exhibit 7: US 2 and 10-year Bond Yield &Spread
Looking Ahead: Major Economic Releases for the Week Ending 28th November
For the upcoming economic releases ending November 21, 2025, Australian data will take center stage mid-week, with inflation indicators including weighted CPI year-on-year, seasonally adjusted CPI month-on-month, and year-on-year figures expected to reflect moderating price pressures amid ongoing central bank vigilance. Capital expenditure for the third quarter is anticipated to show modest growth, signaling potential stabilization in business investment despite global headwinds. These metrics could underscore resilience in Australia’s economy, though softer inflation might ease rate hike expectations, supporting consumer spending while risking currency depreciation if export sectors weaken.
In the United States, a broad delay in data releases for October and November persists due to the longest government shutdown in history. Nonetheless, upcoming releases include PPI for machine manufacturing, expected to remain stable, alongside retail sales month-on-month projected to moderate slightly, suggesting tempered consumer spending. Consumer confidence may edge higher, reflecting guarded optimism. Durable goods orders are anticipated to rebound, while initial jobless claims could dip, pointing to labor market strength. New home sales might show a pickup, supporting housing sector recovery. These data points may underscore economic resilience, influencing Federal Reserve decisions on interest rates, though shutdown-related delays and fiscal uncertainties could amplify volatility, risking investor sentiment and broader market stability.
Major Economic Releases for the Week ending 28 Nov, 2025