

Interest Rate & Market Commentary for Week Ending 27th June 2025
Weekly Overview
The three major U.S. stock indexes surged around 4% for the week as falling oil prices and easing trade tensions boosted investor sentiment. The S&P 500 on Friday eclipsed a record high that it had set four months earlier while the NASDAQ topped a record reached last December. The Dow remained nearly 3% below its historic peak.
Yields of U.S. government bonds fell for the third week in a row, with yields of notes with shorter maturities posting the biggest declines. On Friday afternoon, the yield of the 10-year U.S. Treasury was 4.28%, down from a recent peak of 4.60% on May 21.
U.S. crude oil was trading around $65 per barrel on Friday afternoon, down 11% for the week as tensions in the Middle East eased, calming fears of a potential supply disruption. As recently as June 18, the price had surged above $75 per barrel. Ahead of a July 9 deadline on reciprocal tariffs, investor sentiment was lifted by updates from the Trump administration on negotiations with China and the European Union. However, the administration on Friday afternoon terminated trade talks with Canada in a dispute over dairy product tariffs and a digital services tax.
The U.S. economy’s contraction in this year’s first quarter was deeper than initially estimated, based on an updated figure released on Thursday. GDP contracted at a 0.5% annual rate versus an earlier estimate of a 0.2% contraction. It’s the first negative GDP reading since the first quarter of 2022. In contrast, the economy expanded at a 2.4% rate in last year’s fourth quarter. At roughly the midpoint of 2025, an index that measures investors’ expectations of short-term U.S. stock market volatility was slightly below its year-end 2024 level and down sharply from its year-to-date high reached in early April. The Cboe Volatility Index closed at 16.3 on Friday, below its year-end level of 17.4 and down from 52.3 on April 8. Inflation climbed further above the U.S. Federal Reserve’s 2.0% long-term target, based on Friday’s reading from the Personal Consumption Expenditures Index. Core PCE inflation excluding food and energy prices rose at an annual rate of 2.7% in May—above economists’ consensus forecast and above the previous month’s 2.5% figure. On a month-to-month basis, inflation rose 0.2%, higher than expectations for 0.1%.
A monthly labor market report due out on Thursday—the day before a U.S. market closure due to the Independence Day holiday—will show whether a recent trend of moderate but better-than-expected jobs growth extended into June. In May, the economy generated 139,000 jobs, above consensus expectations for around 130,000. However, initial estimates for the previous two months’ gains were revised downward.
Overview of the US Equities Market
Wall Street investors set aside a flurry of tariff headlines to drive stocks to all-time highs, capping a week that saw a cooling in Middle East geopolitical risks and signs the US economy is holding up amid subdued inflation.
A surge in equities after April’s tariff-fuelled meltdown drove the S&P 500 to its first record since February, with the gauge topping 6,170. Tech mega caps led gains, with Nvidia Corp. approaching the $4 trillion mark and Alphabet Inc. up almost 3%. President Donald Trump touted progress on trade deals with a few countries, naming agreements with China and the UK, while saying he was ending discussions with Canada. Indeed, with earnings season just weeks away, stocks will get a major test.
While a report on Friday showed US consumer sentiment hit a four-month high in June as inflation expectations improved, other data this week painted a less encouraging picture. Purchases of new homes fell in May by the most in almost three years. Recurring applications for unemployment benefits are now at the highest level since 2021, aligning with other data pointing to a slowdown in the labor market. Consumer spending declined in May by the most since the start of the year.
On the economic front, consumer sentiment rose sharply to a four-month high and inflation expectations improved notably. Data also showed that while the core personal consumption expenditures price index rose slightly more than expected, the pace was consistent with limited price pressures that will allow the Federal Reserve to resume rate cuts later this year.
Those reports were backdrop to testimony this week by Fed Chair Jerome Powell before Congress, where he said interest rates would probably be coming down already if not for uncertainty around Trump’s trade policy. He joined a parade of central bank officials who made clear in speeches that they’ll need a few more months to be sure tariff-driven price hikes won’t raise inflation in a persistent way.
None of that derailed the risk rally. The S&P 500 surged 3.4% this week and closed at a record high. Junk bonds extended gains for a fifth week as 10-year Treasury yields fell around 10 basis points. Bitcoin is back above $100,000, and Coinbase Global Inc. hit its first record since 2021. Altogether, the pan-asset tandem rallies in June of US stocks, long-dated Treasuries, junk bonds and the Bloomberg Commodity Index set them for their best monthly performance in 13 months.
Overview of the US Treasuries Market
Yields of U.S. government bonds fell for the third week in a row, with yields of notes with shorter maturities posting the biggest declines. On Friday afternoon, the yield of the 10-year U.S. Treasury was 4.28%, down from a recent peak of 4.60% on May 21, the 2-year yield ended at 3.3% while the 30-year yield reached 4.85%. Junk bonds extended gains for a fifth week as 10-year Treasury yields fell around 10 basis points.
The advance has been driven by several economic data points that reinforced rate-cut wagers and by speculation President Donald Trump will name a more dovish Fed chief. Fed officials Christopher Waller and Michelle Bowman have also signaled in recent days they’d be open to lowering rates as soon as the next meeting.
The gains for the week came even after the bonds slipped on Friday. Yields on maturities across the curve rose following the release of economic data that pointed to firmer-than-expected inflation.
The move pushed down yields across maturities, with most tenors falling to the lowest level in more than a month. A Bloomberg Treasuries index has returned about 0.6% for the week.
Other tailwinds to Treasuries include proposed US changes to a key capital buffer, which Powell said should bolster banks’ roles as intermediaries in the market. Meanwhile, the removal of the Section 899 “revenge tax” proposal that had been worrying Wall Street had little market impact, though it could improve sentiment toward US assets at the margin.
Short-dated bonds — which are more tied to the outlook for Fed policy — gained the most following the release, with two-year yields dipping seven basis points to 3.71% by the end of the session. The widely watched spread between the five- and 30-year points increased to more than 101 basis points for the first time since 2021 and a $44 billion auction of seven-year notes was well received. A steepening yield curve is generally associated with expectations for Fed rate cuts.
Money markets continued to project at least two Fed cuts by the end of this year. Wagers on a third reduction could gain momentum with other data released during the week. While a report on Friday showed US consumer sentiment hit a four-month high in June as inflation expectations improved, other data this week painted a less encouraging picture. Purchases of new homes fell in May by the most in almost three years. Recurring applications for unemployment benefits are now at the highest level since 2021, aligning with other data pointing to a slowdown in the labor market. Consumer spending declined in May by the most since the start of the year.
The U.S. economy’s contraction in this year’s first quarter was deeper than initially estimated, based on an updated figure released on Thursday. GDP contracted at a 0.5% annual rate versus an earlier estimate of a 0.2% contraction. It’s the first negative GDP reading since the first quarter of 2022. In contrast, the economy expanded at a 2.4% rate in last year’s fourth quarter.
Those reports were backdrop to testimony this week by Fed Chair Jerome Powell before Congress, where he said interest rates would probably be coming down already if not for uncertainty around Trump’s trade policy. He joined a parade of central bank officials who made clear in speeches that they’ll need a few more months to be sure tariff-driven price hikes won’t raise inflation in a persistent way.
Ahead of a July 9 deadline on reciprocal tariffs, investor sentiment was lifted by updates from the Trump administration on negotiations with China and the European Union. However, the administration on Friday afternoon terminated trade talks with Canada in a dispute over dairy product tariffs and a digital services tax.
Investors and analysts reckon Powell’s replacement will grant the president’s demands that the Fed cut interest rates right away, causing traders to price in faster and deeper cuts beginning around mid-2026, when Powell’s term ends. Fed Governors Christopher Waller and Michelle Bowma,n in the past wee,k have signaled they’d be open to lowering rates as soon as the next meeting.
Potential contenders to succeed Powell include former Fed Governor Kevin Warsh, current Fed Governor Christopher Waller, National Economic Council Director Kevin Hassett, former World Bank President David Malpass and US Treasury Secretary Scott Bessent, Bloomberg News has previously reported. US consumer sentiment rose sharply in June to a four-month high and inflation expectations improved notably as concerns eased about the economic outlook and personal finances. The final June sentiment index increased to 60.7 from 52.2 a month earlier, according to the University of Michigan. The 8.5-point increase was the largest since the start of 2024. The median estimate in a Bloomberg survey of economists called for no change from the preliminary reading of 60.5.
Consumers expect prices to rise 5% over the next year, data released Friday showed. That is down slightly from the preliminary reading. It’s also far better than the 6.6% registered in May — the biggest monthly improvement since 2001. They saw costs rising at an annual rate of 4% over the next five to 10 years, also lower than a month earlier.
Overview of the Australian Equities Market
On 27 June 2025, the Australian share market experienced a modest decline. The benchmark S&P/ASX200 index gave up its modest morning gains on Friday to finish on the lows of the day, losing 36.6 points, or 0.43 per cent, at 8,514.2. Solid gains by the mining sector were not enough to keep the Australian share market in the green, while the dollar has climbed to its highest level of 2025 against its faltering US counterpart.
The materials sector rose 2.3 per cent on Friday, its best day since a 6.3 per cent gain on April 10, as iron ore prices climbed to $94.50 a tonne. BHP advanced 3.9 per cent to $108.97, Rio Tinto gained 4.6 per cent to $108.97 and Fortescue added 3.6 per cent to $15.46. Across the banking sector, Commonwealth Bank (CBA) dipped 0.4% to $190.71, National Australia Bank (NAB) fell 0.4% to $39.89, ANZ surged 2.2% to $29.74 while Westpac edged up to $34.57.
Within Tech and Industrials, DroneShield (DRO) jumped 11.7% after announcing a major European military deal., Humm Group (HUM) rose 3.7% following a takeover offer., Neuren Pharmaceuticals (NEU) gained 6.1% after a US patent approval. Xero (XRO) dropped 5.3% after completing a $1.85 billion capital raise.
The ASX200 finished the week up 0.1 per cent after a rally on Tuesday following the Iran-Israel ceasefire. Over the week, the best performing sectors were Gold (+5.5%), Banks (+0.9%), Small Ords (+0.6%) and Tech (+0.4%). With one more day of trading left in 2024/25, the ASX200 is on track to deliver an annual return of 13.9 per cent, including dividends or 10 per cent excluding dividends. This is not a bad return for the FY, given the tariff and geopolitical noise that investors had to accept in their decision making.
Overview of the Australian Government Bond Market
On 27 June 2025, the Australian government bond market posted modest gains, reflecting a mix of global uncertainty and domestic economic signals. The Bloomberg AusBond Composite 0+ Yr Index rose 0.16%, indicating a slight uptick in bond prices. The benchmark 10-year bond yields increased to 4.17%, up 4 basis points from the previous session. The 3-year bonds edged up to 3.27%, while 30-year bonds held steady at 4.83%. The short-term 3-month bank bills dropped 15 basis points to 3.73%.
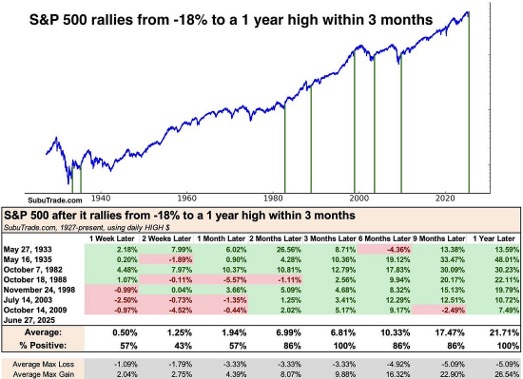
Chart of the Week- S&P500 Rallies
Our chart of the week shows past instances when the US stock market rallied to a 1-year high within 3 months following a major decline, such as big and fast recoveries. This is the type of behaviour you see around major market bottoms. But perhaps the best historical analogue of all these examples is the late-90s (i.e. a late-cycle reset, rather than a bear market bottom).
Figure 1 S&P 500 Rallies
Market Summary Table

Looking Ahead: Major Economic Releases for the Week Ending 04 Jul
This week, ending June 27, 2025, the Australian Consumer Price Index (CPI) data for May 2025 is likely to show inflation continuing to ease, potentially reducing household financial strain. This could encourage the Reserve Bank of Australia (RBA) to consider interest rate cuts at its July 2025 meeting to stimulate growth in sectors like retail and housing. However, global trade uncertainties, particularly US tariffs, may pose risks to Australia’s export-driven economy. As for the US, the final GDP estimate for Q1 2025 is expected to confirm an economic contraction, driven by increased imports and reduced government spending. Despite this, May 2025 PCE price indices and personal consumption data are expected to indicate moderating inflation and economic resilience. Consumer confidence and sentiment for June 2025 are likely to remain stable, supported by recent trade deal progress, though geopolitical and trade tensions persist.
| Date | Country | Release | Consensus | Prior |
|---|---|---|---|---|
| Monday, 30/06 | Australia | S&P Global Mfg PMI Final | n/a | 51 |
| Tuesday, 01/07 | United States | S&P Global Mfg PMI Final | n/a | 52 |
| Tuesday, 01/07 | United States | ISM Manufacturing PMI | n/a | 48.5 |
| Wednesday, 02/07 | Australia | Retail Sales MM Final | 0.3 | -0.1 |
| Wednesday, 02/07 | Australia | S&P Global Svs PMI Final | n/a | 51.3 |
| Wednesday, 02/07 | Australia | S&P Global Comp PMI Final | n/a | 51.2 |
| Thursday, 03/07 | Australia | Goods/Services Imports | n/a | 1.1 |
| Thursday, 03/07 | Australia | Goods/Services Exports | n/a | -2.4 |
| Thursday, 03/07 | United States | Non-Farm Payrolls | 129 | 139 |
| Thursday, 03/07 | United States | Unemployment Rate | 4.2 | 4.2 |
| Thursday, 03/07 | United States | International Trade $ | n/a | -61.6 |
For more detailed weekly updates, please click here.