News

Low growth in euro-zone continues; ESI ticks up in November

28 November 2024

Summary: Euro-zone composite sentiment indicator up a touch in November, slightly above expectations; German, French 10-year yields moved lower; readings up in three of five sectors; up in two of four largest euro-zone economies; index implies annual GDP growth rate of 0.6%.

The European Commission’s Economic Sentiment Indicator (ESI) is a composite index comprising five differently weighted sectoral confidence indicators.  It is heavily weighted towards confidence surveys from the business sector, with the consumer confidence sub-index only accounting for 20% of the ESI. However, it has a good relationship with euro-zone GDP growth rates, although not necessarily as a leading indicator.

According to the latest survey taken by the European Commission, confidence has improved a touch on average across the various sectors of the euro-zone economy in November. The ESI posted a reading of 95.8, slightly above the generally expected figure of 95.2 as well as October’s revised reading of 95.7. The average reading since 1985 is just under 100.

Long-term German and French 10-year bond yields moved lower on the day. By the close of business, the German 10-year yield had lost 4bps to 2.13% while the French 10-year yield finished 8bps lower at 2.94%.

Confidence improved in three of the five sectors of the euro-zone economy. On a geographical basis, the ESI increased in two of four of the euro-zone’s largest economies.

End-of-quarter ESI readings and annual euro-zone GDP growth rates are highly correlated. This latest reading corresponds to a year-to-November GDP growth rate of 0.6%, unchanged from October’s implied growth rate.

Structural changes driving capex; up 1.1% in September

28 November 2024

Summary: Private capital expenditures up 1.1% in September quarter, essentially in line with expectations; up 1.0% on annual basis; Westpac: industries at forefront of underlying structural changes continue investing; ACGB yields down; rate-cut expectations harden; Westpac: industries at coalface of consumer-led slow down pulling back on investment plans,; 2024/25 capex estimate 5.1% higher than previous estimate, 4.3% higher than comparable estimate from 2023/24; Westpac: non-mining sectors facing more pressures to expand capacity to meet demand from rising population, carbon emission targets.

Australia’s private capital expenditure (capex) spiked early in the 2010s on the back of investment in the mining sector. As projects were completed, capex growth rates fell away and generally remained negative for a good part of a decade. Capex as a percentage of GDP is now back to a level more in line with the long-term average.

According to the latest ABS figures, seasonally-adjusted private sector capex in the September quarter increased by 1.1%. The result was essentially in line with expectations but in contrast with June quarter’s 2.2% fall. On a year-on-year basis, total capex increased by 1.0%, up from -0.1% in the previous quarter after revisions.

“Today’s outcomes further demonstrates that the industries at the forefront of the underlying structural changes impacting the economy continue to invest and build their capital stocks,” said Westpac senior economist Pat Bustamante. “Electricity generation, information and telecommunications, professional services [and] construction all continue to invest.”

Commonwealth Government bond yields fell almost uniformly across the curve on the day. By the close of business, 3-year and 10-year ACGB yields had both lost 6bps to 3.91% and 4.37% respectively while the 20-year yield finished 5bps lower at 4.71%.

Expectations regarding rate cuts in the next twelve months hardened. Cash futures contracts implied an average of 4.33% in December, 4.295% in February and 4.11% in May. October 2025 contracts implied 3.82%, 52bps less than the current cash rate.

“On the other hand, industries at the coalface of the consumer-led slow down are now clearly pulling back on their investment plans, including wholesale trade, accommodation and food services, retail trade and arts and recreation,” added Bustamante.

The report also contains capex estimates for the current financial year. The latest capex estimate for the 2024/25 financial year, Estimate 4, is $178.2 billion, 5.1% higher than May’s Estimate 3 and 4.3% higher than Estimate 4 of the 2023/24 financial year.

“Investment in the mining sector has been relatively subdued since the end of the mining boom, while other sectors are facing more pressures to expand capacity and transform their operations to meet the demand of rising population and comply with carbon emission targets,” Bustamante noted. “Indeed, the ABS notes that construction, electricity generation and transport and warehousing revised their expected capex significantly higher over the quarter.”

US disinflation progress “stalling”; core PCE prices up 0.3% in October

27 November 2024

Summary: US core PCE price index up 0.3% in October, in line with expectations; annual rate ticks up to 2.8%; Westpac: disinflation progress appears to be stalling; Treasury yields fall; Fed rate-cut expectations firm.

One of the US Fed’s favoured measures of inflation is the change in the core personal consumption expenditures (PCE) price index. After hitting the Fed’s target at the time of 2.0% in mid-2018, the annual rate then hovered in a range between 1.8% and 2.0% before it eased back to a range between 1.5% and 1.8% through 2019. It then plummeted below 1.0% in April 2020 before rising back to around 1.5% in the September quarter of that year. It has since increased significantly and still remains above the Fed’s target even after recent declines.

The latest figures have now been published by the Bureau of Economic Analysis as part of the October personal income and expenditures report. Core PCE prices rose by 0.3% over the month, in line with expectations as well as September’s increase. On a 12-month basis, the core PCE inflation rate ticked up from 2.7% to 2.8%.

“This marked an acceleration in the annual pace of inflation on both headline and core measures, while monthly momentum was unchanged on September,” said Westpac economist Jameson Coombs. “While the risks of a renewed inflation outbreak remain low, disinflation progress appears to be stalling, supporting the Fed’s cautious approach to policy easing.”

US Treasury bond yields fell moderately along the curve on the day. By the close of business, the 2-year Treasury bond yield had lost 2bps to 4.23%, the 10-year yield had shed 4bps to 4.26% while the 30-year yield finished 3bps lower at 4.44%.

In terms of US Fed policy, expectations of a lower federal funds rate in the next 12 months firmed, with another two 25bp cuts currently factored in. At the close of business, contracts implied the effective federal funds rate would average 4.51% in December, 4.415% in January and 4.365% in February. October 2025 contracts implied 3.92%, 66bps less than the current rate.

The core version of PCE strips out energy and food components, which are volatile from month to month, in an attempt to identify the prevailing trend. It is not the only measure of inflation used by the Fed; the Fed also tracks the Consumer Price Index (CPI) and the Producer Price Index (PPI) from the Department of Labor. However, it is the one measure which is most often referred to in FOMC minutes.

Sep quarter construction spending up 1.6%; public works main driver

27 November 2024

Summary: Construction spending up 1.6%, more than expected; up 3.2% from September 2023 quarter; Westpac: dynamics associated with Australian construction activity remain little changed; ACGB yields generally fall; rate-cut expectations soften; Westpac: public infrastructure works main driver behind growth in overall activity; residential sector up 1.8%, non-residential building down 1.0%, engineering up 2.6%.

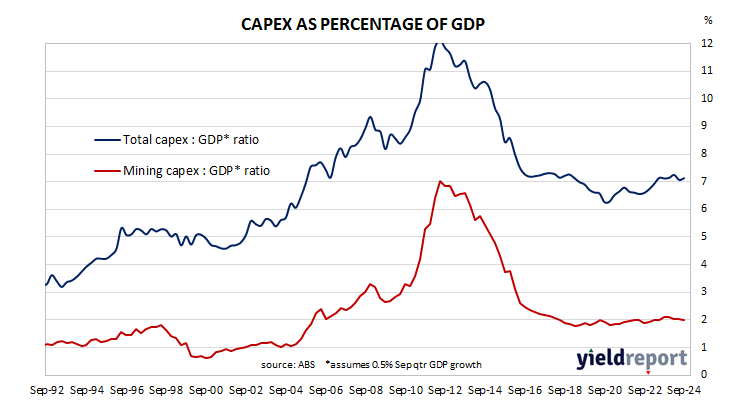
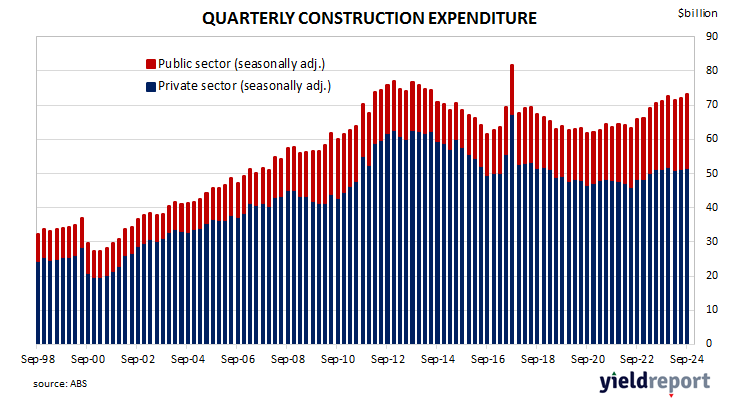
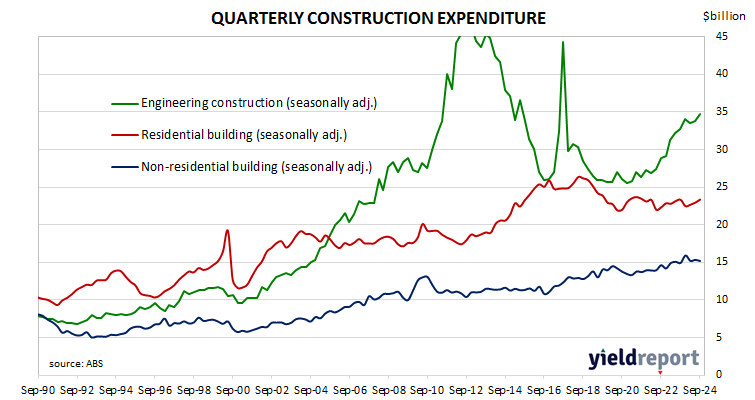
Construction expenditure increased substantially in Australia in the early part of last decade following a more-steady expansion through the 2000s. A large portion of the increase came from the commissioning of new projects and the expansion of existing ones to exploit a tripling in price of Australia’s mining exports in the previous decade.

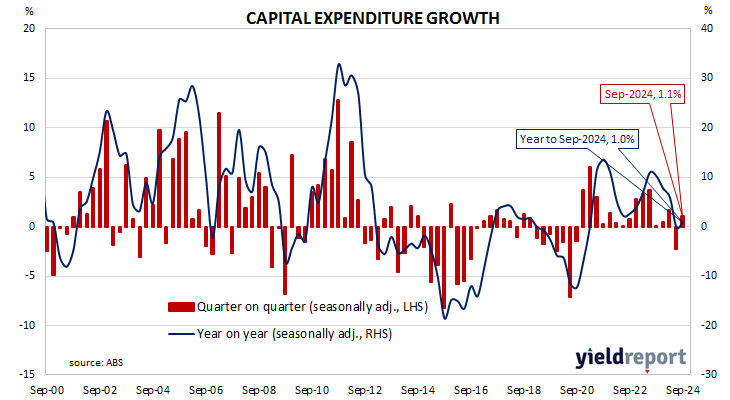
According to the latest construction figures published by the ABS, total construction in the September quarter increased by 1.6% on a seasonally adjusted basis. The result was more than the 0.5% increase which had been generally expected as well as the June quarter’s 1.1% rise after revisions. On an annual basis, the growth rate increased from 2.4% to 3.2%.

“Despite the stronger quarterly result and upward revisions, the key dynamics associated with Australian construction activity remain little changed,” said Westpac senior economist Ryan Wells.

The figures came out at the same time as October CPI numbers and domestic Treasury bond yields generally fell with the exception of 20-year yields which corrected for the previous day’s outsized move. By the close of business, the 3-year ACGB yield had lost 2bps to 3.97%, the 10-year yield had shed 3bps to 4.43% while the 20-year yield finished 6bps higher at 4.76%.

Expectations regarding rate cuts in the next twelve months softened. Cash futures contracts implied an average of 4.33% in December, 4.295% in February and 4.13% in May. October 2025 contracts implied 3.88%, 46bps less than the current cash rate.

“The composition continues to emphasise the importance of public infrastructure works as the main driver behind growth in overall construction activity,” Wells added. “Both State and Federal Government budgets have boosted the construction project pipeline and have provided a floor underneath current and future activity.”

Residential building construction expenditures increased by 1.8%, up from the June quarter rise of 1.2% after revisions. On an annual basis, expenditure in this segment was 0.1% higher than the September 2023 quarter, in contrast with the June’s quarter’s 1.0% decrease.

Non-residential building spending decreased by 1.0%, in contrast with the previous quarter’s 0.9% rise. On an annual basis, expenditures were 1.7% higher than the September 2023 quarter, in line with the June quarter’s increase after revisions.

Engineering construction increased by 2.8% in the quarter, up from the 1.0% rise in the previous quarter. Spending on an annual basis in this segment was 6.0% higher than the September 2023 quarter, up from the June quarter’s comparable figure of 5.2% after revisions.

Quarterly construction data compiled and released by the ABS are not considered to be of a “primary” nature, unlike unemployment (Labour Force) and inflation (CPI) figures. However, the figures are viewed by economists and analysts with interest as they directly feed into quarterly GDP figures which are next due in early September.

Conf. Board sentiment index continues rise in November

26 November 2024

Summary: Conference Board Consumer Confidence Index up in October, below expectations; index at top of range which has prevailed over past two years; short-term US Treasury yields decline, longer-term yield rise; expectations of Fed rate cuts largely unchanged, two more cuts priced in; views of present conditions, short-term outlook both improve; mainly driven by more positive consumer assessments of labour market.

US consumer confidence clawed its way back to neutral over the five years after the GFC in 2008/2009 and then went from strength to strength until late 2018. Measures of consumer confidence then oscillated within a relatively narrow band at historically high levels until they plunged in early 2020. Subsequent readings then fluctuated around the long-term average until March 2021 when they returned to elevated levels. However, a noticeable gap has since emerged between the two most-widely followed surveys.

The latest Conference Board survey completed in mid-November indicates its index of US consumer confidence has improved again, maintaining a level which is well above average. The latest reading of the Consumer Confidence Index registered 111.7 on a preliminary basis, slightly below the generally-expected figure of 112.5 but up from October’s final figure of 109.6.

“Consumer confidence continued to improve in November and reached the top of the range that has prevailed over the past two years,” said Dana Peterson, Chief Economist at The Conference Board.

Short-term US Treasury bond yields declined on the day while longer-term yields rose moderately. By the close of business, the 2-year Treasury bond yield had lost 2bps to 4.25%, the 10-year yield had gained 3bps to 4.30% while the 30-year yield finished 2bps higher at 4.47%.

In terms of US Fed policy, expectations of a lower federal funds rate in the next 12 months remained largely unchanged, with another two 25bp cuts currently factored in. At the close of business, contracts implied the effective federal funds rate would average 4.525% in December, 4.425% in January and 4.37% in February. October 2025 contracts implied 3.96%, 62bps less than the current rate.

Consumers’ views of present conditions and the near-future both improved. The Present Situation Index increased from October’s revised figure of 136.1 to 140.9 while the Expectations Index rose from 91.9 to 92.3.

“November’s increase was mainly driven by more positive consumer assessments of the present situation, particularly regarding the labour market,” Peterson added. “Compared to October, consumers were also substantially more optimistic about future job availability, which reached its highest level in almost three years. Meanwhile, consumers’ expectations about future business conditions were unchanged and they were slightly less positive about future income.”

The Consumer Confidence Survey is one of two widely followed monthly US consumer sentiment surveys which produce sentiment indices. The Conference Board’s index is based on perceptions of current business and employment conditions, as well as respondents’ expectations of conditions six months in the future. The other survey, conducted by the University of Michigan, is similar and it is used to produce an Index of Consumer Sentiment. That survey differs in that it does not ask respondents explicitly about their views of the labour market and it also includes some longer-term questions.

US leading index falls in October; “challenges” ahead

21 November 2024

Summary: Conference Board leading index down 0.4% in October, fall slightly larger than expected; CB: reading suggest challenges to economic activity ahead; US Treasury yields rise; rate-cut expectations soften; CB: manufacturer new orders largest negative contributor to index decline.

The Conference Board Leading Economic Index (LEI) is a composite index composed of ten sub-indices which are thought to be sensitive to changes in the US economy. The Conference Board describes it as an index which attempts to signal growth peaks and troughs; turning points in the index have historically occurred prior to changes in aggregate economic activity. Readings from March and April of 2020 signalled “a deep US recession” while subsequent readings indicated the US economy would recover rapidly. Post-2022 readings implied US GDP growth rates would turn negative but that has not been the case so far.

The latest reading of the LEI indicates it decreased by 0.4% in October. The fall was a slightly larger one than the 0.3% decline which had been generally expected as well as August’s upwardly-revised 0.3% decrease.

“Apart from possible temporary impacts of hurricanes, the US LEI continued to suggest challenges to economic activity ahead,” said Justyna Zabinska-La Monica of The Conference Board.

US Treasury bond yields generally rose modestly across a slightly flatter curve on the day. By the close of business, the 2-year Treasury yield had gained 3bps to 4.35% while 10-year and 30-year yields both finished 1bps higher at 4.42% and 4.61% respectively.

In terms of US Fed policy, expectations of a lower federal funds rate in the next 12 months softened, although at least another two 25bp cuts are still factored in. At the close of business, contracts implied the effective federal funds rate would average 4.525% in December, 4.435% in January and 4.385% in February. October 2025 contracts implied 3.96%, 62bps less than the current rate.

“The largest negative contributor to the LEI’s decline came from manufacturer new orders, which remained weak in 11 out of 14 industries,” added Zabinska-La Monica. “In October, manufacturing hours worked fell by the most since December 2023, while unemployment insurance claims rose and building permits declined, partly reflecting the impact of hurricanes in the Southeast US. Additionally, the negative yield spread continued to weigh on the LEI.”

Regression analysis suggests the latest reading implies a 0.4% year-on-year growth rate in January, up from the 0.2% year-to-December growth rate after revisions.

Two steps forward, one back; euro-zone household sentiment index falls in November

21 November 2024

Summary: Euro-zone consumer sentiment deteriorates in November, below expectations; consumer confidence index below long-term average; Westpac: improvement in confidence slows to negligible rate; euro-zone bond yields move inconsistently.

EU consumer confidence plunged during the GFC and again in 2011/12 during the European debt crisis. After bouncing back through 2013 and 2014, it fell back significantly in late 2018 but only to a level which corresponds to significant optimism among households. Following the plunge which took place in April 2020, a recovery began a month later, with household confidence returning to above-average levels from March 2021. However, readings subsequent to early 2022 were extremely low by historical standards until recently.

Consumer confidence deteriorated in November after improving over the previous two months, according to the latest survey conducted by the European Commission over the first three weeks of the month. Its Consumer Confidence Indicator recorded a reading of -13.7, below the generally expected figure of -12.4 and down from October’s reading of -12.5. This latest reading is below the long-term average of -10.5 but it is still above the lower bound of the range in which “normal” readings usually occur.

“Over the past six months, the improvement in confidence has slowed to a negligible rate having recovered from a low of -28.6 in 2022,” said Westpac senior economist Pat Bustamante. “Growth and the labour market is favourable in aggregate, but conditions are mixed by country.”

Sovereign bond yields in major euro-zone bond markets moved inconsistently on the day. By the close of business, the German 10-yar yield had lost 4bps to 2.31% while the French 10-year yield finished unchanged at 3.11%.

“Tentative normalisation”? Westpac-MI leading index above zero

20 November 2024

Summary: Leading index growth rate rises in October; Westpac: slightly negative for best part of a year; reading implies annual GDP growth of around 2.75%-3.00%; ACGB yields generally decline a little; rate-cut expectations barely move; Westpac: latest reading is best interpreted as pointing to tentative normalisation in growth.

Westpac and the Melbourne Institute describe their Leading Index as a composite measure which attempts to estimate the likely pace of Australian economic growth in the short-term. After reaching a peak in early 2018, the index trended lower through 2018 and 2019 before plunging to recessionary levels in the second quarter of 2020. Subsequent readings spiked towards the end of 2020 but then trended lower through 2021 and 2022 before flattening out in 2023 and 2024.

October’s reading has now been released and the six month annualised growth rate of the indicator registered +0.26%, up from September’s revised figure of -0.20%. The index reading represents a rate relative to “trend” GDP growth, which is generally thought to be around 2.50% to 2.75% per annum in Australia.

“The Leading Index growth rate’s sudden lift into positive territory provides a more constructive signal on the economy’s future momentum,” said Westpac economist Ryan Wells.

Westpac states the index leads GDP growth by “three to nine months into the future” but the highest correlation between the index and actual GDP figures occurs with a three-month lead. The current reading may therefore be considered to be indicative of an annual GDP growth rate of around 2.75% to 3.00% in the next quarter.

Short-term domestic Treasury bond yields finished steady on the day while longer-term yields declined a little. By the close of business, the 3-year ACGB yield had returned to its starting point at 4.08% while 10-year and 20-years both finished 1bp lower at 4.57% and 4.90% respectively.

Expectations regarding rate cuts in the next twelve months barely moved, with a February cut currently viewed as unlikely. Cash futures contracts implied an average of 4.32% in December and 4.295% in February 2025. October 2025 contracts implied 3.885%, 45bps less than the current cash rate.

“The last month has seen the realisation of significant event risk, particularly around the US election,” Ryan added. “The reverberations from these events are still being digested. For that reason, the latest reading is best interpreted as pointing to a tentative normalisation in economic growth from its current subdued pace, given the backdrop of consistent sluggish readings.”

The RBA’s November Statement on Monetary Policy GDP growth forecasts are pretty much in line with Westpac’s latest numbers, which are 1.5% for calendar 2024 and 2.4% for calendar 2025.  The RBA forecasts GDP growth for the years ending December 2024 and December 2025 to be 1.5% and 2.3% respectively.

More strikes, more hurricanes; US industrial output hit again

15 November 2024

Summary: US industrial output down 0.3% in October, fall slightly larger than expected; down 0.3% over past 12 months; ANZ: strikes, hurricanes, hit production for second month; short-term US Treasury yields fall, longer-term yields either steady or up slightly; rate-cut expectations firm; capacity utilisation rate falls to 77.1%, below long-term average.

The Federal Reserve’s industrial production (IP) index measures real output from manufacturing, mining, electricity and gas company facilities located in the United States. These sectors are thought to be sensitive to consumer demand and so some leading indicators of GDP use industrial production figures as a component. US production collapsed through March and April of 2020 before recovering the ground lost over the fifteen months to July 2021. However, production levels has largely stagnated since early 2022.

According to the Federal Reserve, US industrial production decreased by 0.3% on a seasonally adjusted basis in October. The fall was a larger one than the 0.2% contraction which had been generally expected but it was a slightly smaller one than September’s downwardly-revised 0.5% contraction. However, the annual contraction rate slowed from September’s revised figure of 0.7% to 0.3%.

“The impact of strikes and a pair of hurricanes likely disrupted manufacturing activity for a second straight month,” said ANZ economist Felix Ryan. “The Fed typically looks through supply-side disruptions when assessing economic activity.”

The figures came out on the same morning as the latest retail sales numbers and short-term US Treasury bond yields fell moderately while longer-term yields either finished steady or increased a touch. By the close of business, the 2-year Treasury yield had lost 5bps to 4.30%, the 10-year had returned to its starting point at 4.44% while the 30-year yield finished 1bp higher at 4.61%.

In terms of US Fed policy, expectations of a lower federal funds rate in the next 12 months firmed, with at least another two 25bp cuts priced in. At the close of business, contracts implied the effective federal funds rate would average 4.515% in December, 4.42% in January and 4.345% in February. October 2025 contracts implied 3.885%, 70bps less than the current rate.

The same report includes capacity utilisation figures which are generally accepted as an indicator of future investment expenditure and/or inflationary pressures. Capacity usage hit a high for the last business cycle in early 2019 before it began a downtrend which ended with April 2020’s multi-decade low of 64.2%. October’s reading decreased by 0.3 percentage points after revisions to 77.1%, 3.0 percentage points below the long-term average.

While the US utilisation rate’s correlation with the US jobless rate is solid, it is not as high as the comparable correlation in Australia.

Headline, core US PPI annual rates rise in October

14 November 2024

Summary: US producer price index (PPI) up 0.2% in October, in line with expectations; annual rate rises to 2.4%; “core” PPI up 0.3% over month, up 3.1% over year; Westpac: consistent with headline CPI inflation at target; short-term US Treasury yields rise, longer-term yields fall; rate-cut expectations soften; ANZ: CPI, PPI data signal October PCE data could be firm; services prices up 0.3%, goods prices up 0.1%.

Around the end of 2018, the annual inflation rate of the US producer price index (PPI) began a downtrend which continued through 2019. Months in which producer prices increased suggested the trend may have been coming to an end, only for it to continue, culminating in a plunge in April 2020. Figures returned to “normal” towards the end of that year but then moved well above the long-term average in 2021 and 2022 before falling back over 2023.

The latest figures published by the Bureau of Labor Statistics indicate producer prices increased by 0.2% in October after seasonal adjustments. The rise was in line with expectations but more than September’s 0.1% increase. On a 12-month basis, the rate of producer price inflation after seasonal adjustments accelerated from 1.9% to 2.4%.

Producer prices excluding foods and energy, or “core” PPI, rose by 0.3% after seasonal adjustments. The rise was more than the 0.2% increase which had been generally expected as well as September’s increase of the same amount. The annual growth rate ticked from 3.0% after revisions to 3.1%.

“On an annual basis, the headline PPI is up 2.4% and the core series 3.1%,” said Westpac senior economist Pat Bustamante. “Both pulses are broadly consistent with headline CPI inflation at target.”

Short-term US Treasury bond yields fell on the day while longer-term yields increased. By the close of business, the 2-year Treasury yield had gained 7bps to 4.35%, the 10-year had slipped 1bp to 4.44% while the 30-year yield finished 3bps lower at 4.60%.

In terms of US Fed policy, expectations of a lower federal funds rate in the next 12 months softened, although at least two 25bp cuts are still priced in. At the close of business, contracts implied the effective federal funds rate would average 4.515% in December, 4.42% in January and 4.35% in February. October 2025 contracts implied 3.935%, 65bps less than the current rate.

“October PPI data showed a slight acceleration in price pressures but no imminent reversal of the disinflation process,” said ANZ economist Felix Ryan. “Together with the CPI data the day before, early estimates signal that October PCE data could be firm.”

The BLS stated the rise of the index was mostly attributable to a 0.3% increase in services prices. The final demand goods index rose by 0.1%.

The producer price index is a measure of prices received by producers for domestically produced goods, services and construction. It is put together in a fashion similar to the consumer price index (CPI) except it measures prices received from the producer’s perspective rather than from the perspective of a retailer or a consumer. It is another one of the various measures of inflation tracked by the US Fed, along with core personal consumption expenditure (PCE) price data. 

Click for more news