US industrial output down 0.6% in October, below expectations; down 0.7% over past 12 months; NAB: UAW strike over, output likely will recover in November; US Treasury yields fall; rate-cut expectations harden; capacity utilisation rate down 0.6ppts to 78.9%, below long-term average.
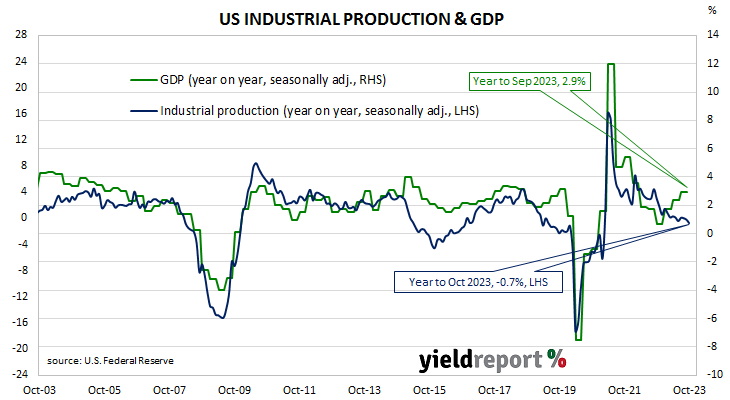
The Federal Reserve’s industrial production (IP) index measures real output from manufacturing, mining, electricity and gas company facilities located in the United States. These sectors are thought to be sensitive to consumer demand and so some leading indicators of GDP use industrial production figures as a component. US production collapsed through March and April of 2020 before recovering the ground lost over the fifteen months to July 2021.
According to the Federal Reserve, US industrial production contracted by 0.6% on a seasonally adjusted basis in October. The result was worse than the 0.4% contraction which had been generally expected and in contrast with September’s 0.1% increase after it was revised down from 0.3%. On an annual basis the contraction rate increased from September’s revised figure of 0.2% to 0.7%.
“Importantly though the UAW strike drove a 10% plunge in motor vehicle production and the strike came to an end on 30 October…so output likely will recover in November,” said NAB Head of Market Economics Tapas Strickland.
US Treasury yields fell substantially on the day. By the close of business, the 2-year Treasury yield had lost 8bps to 4.84%, the 10-year yield had shed 10bps to 4.44% while the 30-year yield finished 8bps lower at 4.62%.
In terms of US Fed policy, expectations of a lower federal funds rate in the next 12 months hardened. At the close of business, contracts implied the effective federal funds rate would average 5.33% in December, in line with the current spot rate, 5.33% in January and 5.295% in March. November 2024 contracts implied 4.54%, 79bps less than the current rate.
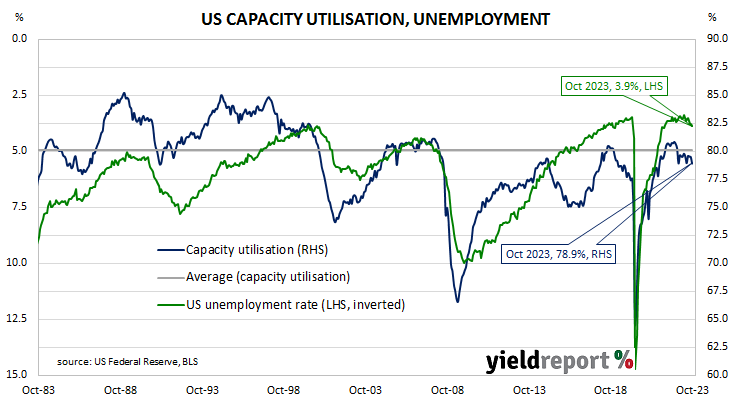
The same report includes US capacity utilisation figures which are generally accepted as an indicator of future investment expenditure and/or inflationary pressures. Capacity usage had hit a high for the last business cycle in early 2019 before it began a downtrend which ended with April 2020’s multi-decade low of 64.2%. October’s reading decreased from September’s downwardly-revised figure of 79.5% to 78.9%, below the long-term average of 80.1%.
While the US utilisation rate’s correlation with the US jobless rate is solid, it is not as high as the comparable correlation in Australia.