
Summary: US non-farm payrolls up 353,000 in December, above expectations; previous two months’ figures revised up by 126,000; jobless rate steady at 3.7%, participation rate steady at 62.5%; ANZ: 3-month average payrolls twice as strong as FOMC officials had assumed; employed-to-population ratio ticks up to 60.2%; underutilisation rate up; annual hourly pay growth up.
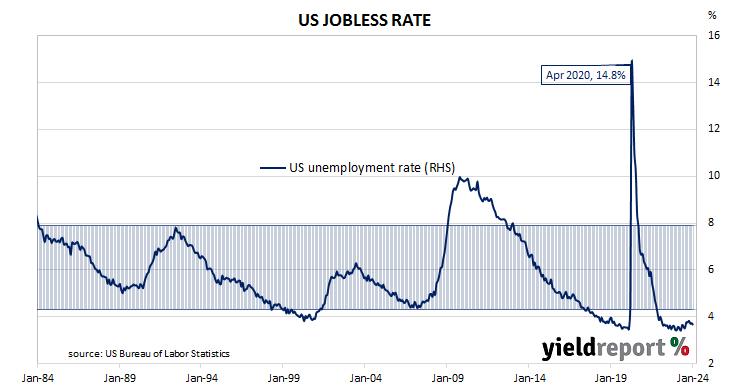
The US economy ceased producing jobs in net terms as infection controls began to be implemented in March 2020. The unemployment rate had been around 3.5% but that changed as job losses began to surge through March and April of 2020. The May 2020 non-farm employment report represented a turning point and subsequent months provided substantial employment gains which continued through into 2021, 2022 and 2023.
According to the US Bureau of Labor Statistics, the US economy created an additional 353,000 jobs in the non-farm sector in January. The increase was considerably higher than the 168,000 rise which had been generally expected and slightly more than the 333,000 jobs which had been added in December. Employment figures for November and December were revised up by a total of 126,000.
“Three-month average payrolls have surged to 289,000, nearly twice as strong as senior FOMC officials had assumed,” said ANZ FX analyst Felix Ryan. “Wage growth is firming, with average hourly earnings up 0.6%, the fastest rise since March 2022. This measure of wage growth has been creeping higher…”
The total number of unemployed decreased by 144,000 to 6.124 million while the total number of people who were either employed or looking for work decreased by 175,000 to 167.276 million. These changes led to the US unemployment rate remaining unchanged from December’s figure of 3.7% while the participation rate remained steady at 62.5%.
US Treasury yields rose significantly across the curve on the day. By the close of business, the 2-year yield had gained 17bps to 4.37%, the 10-year yield had added 16bps to 4.02% while the 30-year yield finished 12bps higher at 4.22%.
In terms of US Fed policy, expectations of a lower federal funds rate in the next 12 months softened, albeit with several cuts still factored in. At the close of business, contracts implied the effective federal funds rate would average 5.30% in March, slightly below the current spot rate, 5.27% in April and 5.10% in May. January 2025 contracts implied 4.07%, 126bps less than the current rate.
One figure which is indicative of the “spare capacity” of the US employment market is the employment-to-population ratio. This ratio is simply the number of people in work divided by the total US population. It hit a cyclical-low of 58.2 in October 2010 before slowly recovering to just above 61% in late-2019. January’s reading ticked up from 60.1% to 60.2%, still some way from the April 2000 peak reading of 64.7%.
Apart from the unemployment rate, another measure of tightness in the labour market is the underutilisation rate and the latest reading of it registered 7.2%, up from 7.1% in December. Wage inflation and the underutilisation rate usually have an inverse relationship; hourly pay growth in the year to January rose from at 4.3% after revisions to 4.5%.
