
Summary: Employment down 6,600 in March, less than expected; Westpac: marks ‘retracement’ from particularly strong February; ACGB yields fall rate-cut expectations firm; MSA: labour market still loosening but pace has slowed materially; participation rate slips back to 66.6%; jobless rate ticks up from 3.7% to 3.8%; fewer part-time jobs, more full-time jobs; aggregate work hours up 0.9%; underemployment rate ticks down to 6.5%.
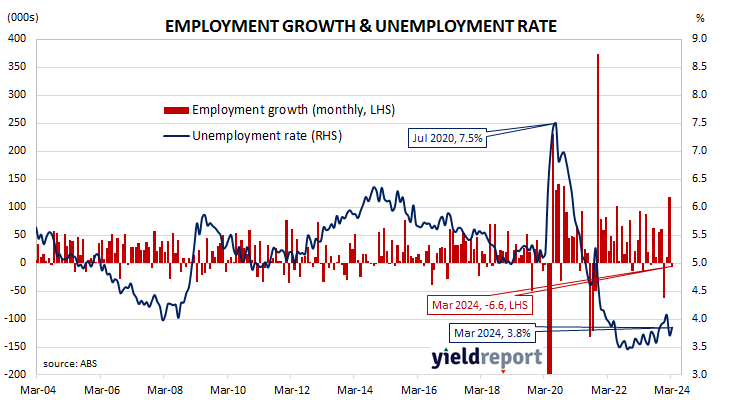
Australia’s period of falling unemployment came to an end in early 2019 when the jobless rate hit a low of 4.9%. It then averaged around 5.2% through to March 2020, bouncing around in a range from 5.1% to 5.3%. Leading indicators such as ANZ-Indeed’s Job Ads survey and NAB’s capacity utilisation estimate suggested the unemployment rate would rise in the June 2020 quarter and it did so, sharply. The jobless rate peaked in July 2020 but fell below 7% a month later and then trended lower through 2021 and 2022.
The latest Labour force figures have now been released and they indicate the number of people employed in Australia according to ABS definitions decreased by 6,600 in March. The result was less than the zero growth which had been generally expected and in contrast with February’s upwardly-revised gain of 116,500.
“While March’s employment print does mark somewhat of a ‘retracement’ from a particularly strong February, it rounds out a more resilient performance for employment growth over the quarter as a whole,” said Westpac economist Ryan Wells.
Domestic Treasury bond yields fell noticeably across the curve on the day, outpacing the falls of US Treasury yields overnight. By the close of business, the 3-year ACGB yield had lost 8bps to 3.85%, the 10-year yield had shed 11bps to 4.29% while the 20-year yield finished 9bps lower at 4.59%.
In the cash futures market, expectations regarding rate cuts in the next twelve months firmed. At the end of the day, contracts implied the cash rate would remain close to the current rate for the next few months and average 4.305% through May and 4.29% in June. However, August contracts implied a 4.24% average cash rate, November contracts implied 4.16%, while May 2025 contracts implied 3.98%, 34bps less than the current rate.
“Looking through the volatility, the labour data suggest a tighter trend than previously, particularly after the soft data in December and January,” said Morgan Stanley Australia economist Chris Read. “On net, the labour market still looks to be loosening but the pace has slowed materially. This is consistent with the suite of labour demand indicators that are all largely above their pre-COVID levels and some…having stabilised noticeably in recent months.”
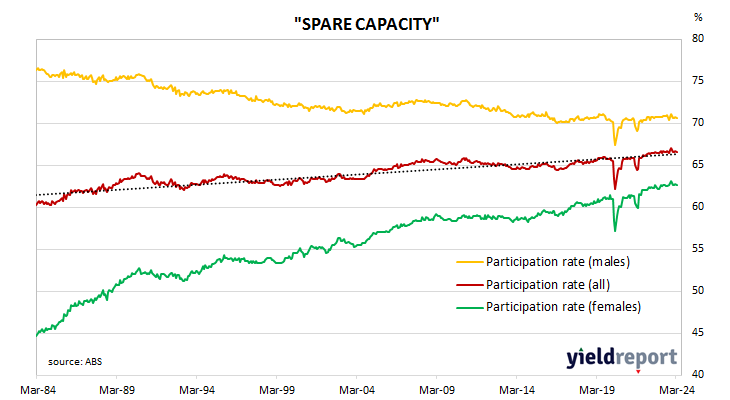
The participation rate slipped back from February’s revised figure of 66.7% to 66.6% as the total available workforce increased by 14,000 to 14.830 million while the number of unemployed persons increased by 20,600 to 569,900. As a result, the unemployment rate ticked up from 3.7% to 3.8%.
The aggregate number of hours worked across the Australian economy rose by 0.9% as 34,500 residents lost part-time positions and 27,900 residents gained full-time positions. On a 12-month basis and after revisions, aggregate hours worked increased by 1.7% as 247,100 more people held part-time positions and 89,900 more people held full-time positions than in March 2023.
More attention has been paid to the underemployment rate in recent years, which is the number of people in work but who wish to work more hours than they do currently. March’s underemployment rate ticked down from February’s figure of 6.6% to 6.5%, 0.6 percentage points above this cycle’s low.
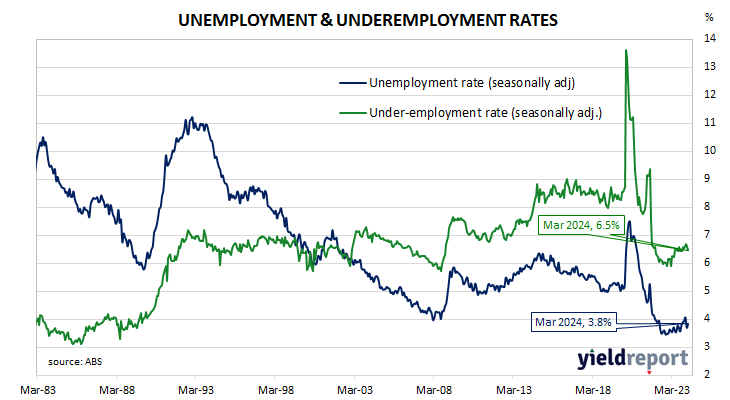
The underutilisation rate, that is the sum of the underemployment rate and the unemployment rate, has a strong correlation with the annual growth rate of the ABS private sector wage index when advanced by two quarters. March’s underutilisation rate of 10.3% corresponds with an annual growth rate of about 4.1%.