
Summary: ISM PMI down in May, below expectations; Westpac: another sign US economic resilience gradually fading; US Treasury yields fall; expectations of Fed rate cuts firm; ISM: reading corresponds to 1.7% US GDP growth annualised.
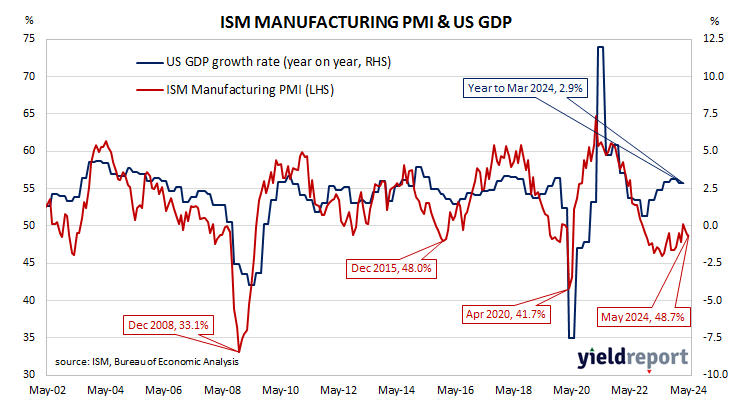
The Institute of Supply Management (ISM) manufacturing Purchasing Managers Index (PMI) reached a cyclical peak in September 2017. It then started a downtrend which ended in March 2020 with a contraction in US manufacturing which lasted until June 2020. Subsequent month’s readings implied growth had resumed, with the index becoming stronger through to March 2021. Readings then declined fairly steadily until mid-2023 and have since generally stagnated.
According to the ISM’s May survey, its PMI recorded a reading of 48.7%, below the generally expected figure of 49.7% as well as April’s reading of 49.2%. The average reading since 1948 is roughly 53.0% and any reading below 50% implies a contraction in the US manufacturing sector relative to the previous month.
“The ISM manufacturing survey surprised to the downside, underpinned by weakness in new orders,” said Westpac economist Jameson Coombs. “The soft reading providing another sign that US economic resilience is gradually fading.”
US Treasury yields fell on the day, with falls heaviest at the long end. By the close of business, the 2-year Treasury bond yield had shed 6bps to 4.81% while 10-year and 30-year yields both finished 11bps lower at 4.39% and 4.54% respectively.
In terms of US Fed policy, expectations of a lower federal funds rate in the next 12 months firmed, with nearly three 25bps cuts currently factored in. At the close of business, contracts implied the effective federal funds rate would average 5.33% in June, in line with the current spot rate, 5.325% in July and 5.235% in September. May 2025 contracts implied 4.61%, 72bps less than the current rate.
Purchasing managers’ indices (PMIs) are economic indicators derived from monthly surveys of executives in private-sector companies. They are diffusion indices, which means a reading of 50% represents no change from the previous period, while a reading under 50% implies respondents reported a deterioration on average. A reading “above 42.5%, over a period of time, generally indicates an expansion of the overall economy”, according to the ISM’s latest calculations.
The ISM’s manufacturing PMI figures appear to lead US GDP by several months despite a considerable error in any given month. The chart below shows US GDP on a “year on year” basis (and not the BEA annualised basis) against US GDP implied by monthly PMI figures.
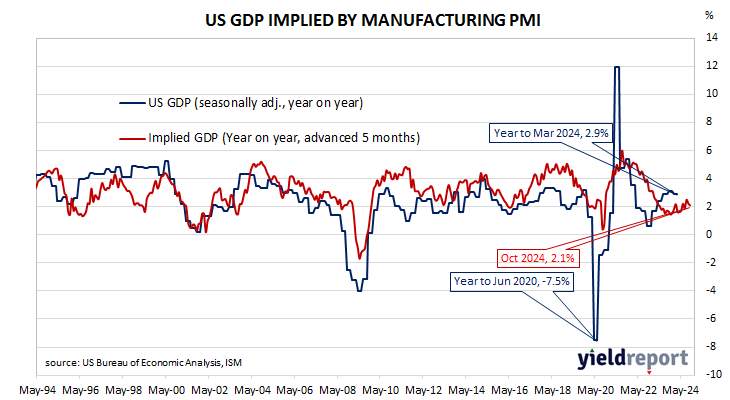
According to the ISM and its analysis of past relationships between the PMI and US GDP, April’s PMI corresponds to an annualised growth rate of 1.9%, or about 0.5% over a quarter. Regression analysis on a year-on-year basis suggests a 12-month GDP growth rate of 2.2% five months after this latest report.
The ISM index is one of two monthly US PMIs, the other being an index published by S&P Global. S&P Global produces a “flash” estimate in the last week of each month which comes out about a week before the ISM index is published. The S&P Global flash April manufacturing PMI registered 49.9%, down 2.0 percentage points from March’s final figure.