Summary: US non-farm payrolls up 272,000 in May, above expectations; previous two months’ figures revised down by 15,000; jobless rate ticks up to 4.0%, participation rate declines to 62.5%; US Treasury yields rise sharply; expectations of Fed rate cuts soften; employed-to-population ratio slips back to 60.1%; underutilisation rate steady at 7.4%; annual hourly pay growth rises to 4.1%.
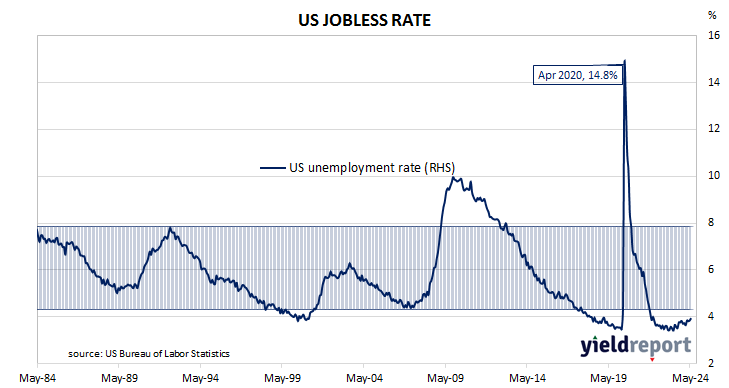
The US economy ceased producing jobs in net terms as infection controls began to be implemented in March 2020. The unemployment rate had been around 3.5% but that changed as job losses began to surge through March and April of 2020. The May 2020 non-farm employment report represented a turning point and subsequent months provided substantial employment gains which continued through into 2021, 2022 and 2023.
According to the US Bureau of Labor Statistics, the US economy created an additional 272,000 jobs in the non-farm sector in May. The increase was noticeably more than the 180,000 rise which had been generally expected and the 165,000 jobs which had been added in April. Employment figures for April and March were revised down by a total of 15,000.
The total number of unemployed increased by 157,000 to 6.649 million while the total number of people who were either employed or looking for work decreased by 251,000 to 167.732 million. These changes led to the US unemployment rate ticking up from April’s figure of 3.9% to 4.0%. The participation rate declined from 62.7 to 62.5%.
US Treasury bond yields rose sharply on the day, especially at the short end of the curve. By the close of business, the 2-year yield had jumped 16bps to 4.89%, the 10-year yield had gained 14bps to 4.43% while the 30-year yield finished 12bps higher at 4.56%.
In terms of US Fed policy, expectations of a lower federal funds rate in the next 12 months softened, although almost three 25bp cuts are still currently factored in. At the close of business, contracts implied the effective federal funds rate would average 5.33% in June, in line with the current spot rate, 5.265% in July and 5.23% in September. May 2025 contracts implied 4.245%, 70bps less than the current rate.
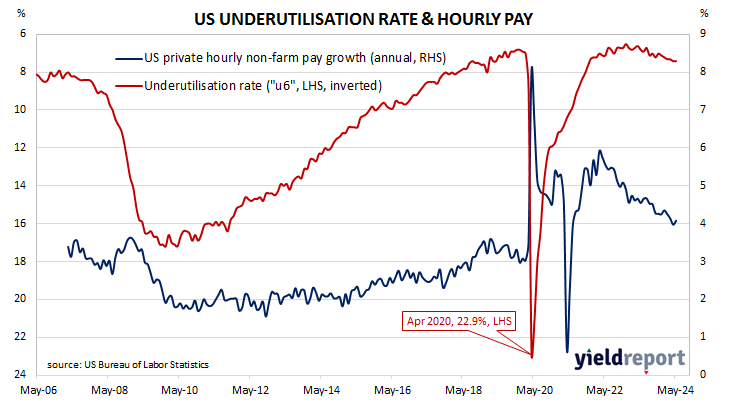
One figure which is indicative of the “spare capacity” of the US employment market is the employment-to-population ratio. This ratio is simply the number of people in work divided by the total US population. It hit a cyclical-low of 58.2 in October 2010 before slowly recovering to just above 61% in early 2020. May’s reading slipped back from 60.2% to 60.1%, some way from the April 2000 peak reading of 64.7%.
Apart from the unemployment rate, another measure of tightness in the labour market is the underutilisation rate and the latest reading of it registered 7.4%, unchanged from April. Wage inflation and the underutilisation rate usually have an inverse relationship; private hourly pay growth in the year to May ticked up from 4.0% to 4.1%%.