Summary: US producer price index (PPI) up 0.2% in June, slightly higher than expected increase; annual rate accelerates to 2.7%; “core” PPI up 0.4% over month, up 3.0% over year; ANZ: increase is attributable to a 1.9% jump in margins for final demand trade services; US Treasury yields fall; rate-cut expectations firm; Westpac; upside surprises do little to sway expectations of upcoming rate cuts; services prices up 0.6%, goods prices down 0.5%.
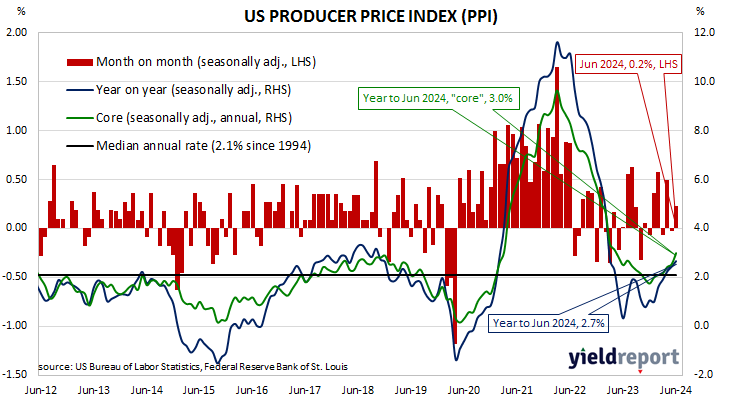
Around the end of 2018, the annual inflation rate of the US producer price index (PPI) began a downtrend which continued through 2019. Months in which producer prices increased suggested the trend may have been coming to an end, only for it to continue, culminating in a plunge in April 2020. Figures returned to “normal” towards the end of that year but then moved well above the long-term average in 2021 and 2022 before falling back over 2023.
The latest figures published by the Bureau of Labor Statistics indicate producer prices increased by 0.2% in June after seasonal adjustments. The result was slightly higher than the 0.1% increase which had been generally expected and it was up from May’s flat figure which was revised from -0.2%. On a 12-month basis, the rate of producer price inflation after seasonal adjustments accelerated from May’s upwardly-revised figure of 2.4% to 2.7%.
Producer prices excluding foods and energy, or “core” PPI, increased by 0.4% after seasonal adjustments. The result was greater than the 0.2% increase which had been generally expected as well as May’s 0.3% rise. The annual growth rate increased from 2.6% after revisions to 3.0%.
“Nearly all the June increase is attributable to a 1.9% jump in margins for final demand trade services, [that is], changes in margins received by wholesalers and retailers,” said ANZ Head of FX Research Mahjabeen Zaman.
Short-term US Treasury bond yields fell noticeably while longer-term yields fell more modestly on the day. By the close of business, the 2-year Treasury yield had lost 7bps to 4.45% while 10-year and 30-year yields both finished 2bps lower at 4.19% and 4.40% respectively.
In terms of US Fed policy, expectations of a lower federal funds rate in the next 12 months firmed, with five 25bp cuts currently factored in. At the close of business, contracts implied the effective federal funds rate would average 5.315% in August, 2bps less than the current spot rate, 5.22% in September and 4.955% in November. June 2025 contracts implied 4.07%, 126bps less than the current rate.
“However, the stronger-than-expected headline figures are less of a focus; more important is how the PPI and earlier consumer price index data flow into the Fed’s preferred inflation measure, the personal consumption expenditure deflator,” said Westpac economist Jameson Coombs. “Here, the upside surprises, which were concentrated on retail margins, did little to sway expectations that Fed members will be pleased by June’s PCE figures, strengthening the case to commence easing policy.”
The BLS stated the fall of the index was attributable to a 0.6% increase in services prices. The final demand goods index fell by 0.5%.
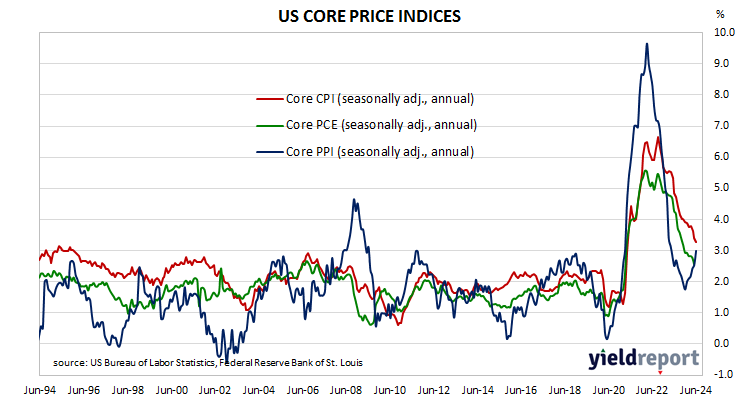
The producer price index is a measure of prices received by producers for domestically produced goods, services and construction. It is put together in a fashion similar to the consumer price index (CPI) except it measures prices received from the producer’s perspective rather than from the perspective of a retailer or a consumer. It is another one of the various measures of inflation tracked by the US Fed, along with core personal consumption expenditure (PCE) price data.