Summary:
Spreads compressed meaningfully this week. In HY, CCC was down 18 bps and B and BB both down 8 bps. In IG, all ratings categories shrank ever so slightly by 1-2 bps.
We make the point again – spreads are not reflecting economic risks. We all know that. We also know that the reason is that there is a fundamental demand/supply imbalance, and that is not going to change. This is akin to Australian equities with Super and ETFs chasing stocks, and a reality few seem to grasp – it is a new world order. Private markets are eating the lunch of public markets in terms of issuance, but there is an ever increasing flow of funds in public markets, and largely through ETFs.
Case in point, in the US IG market in the last three months, $400 billion has been issued. But if you net that of maturities and coupons it reverts to circa zero.
We know that on a fundamental basis spreads are tighter than they should be. For example, for B rated HY at circa 350 bps, that equates to a forward implied default rate of about 3.5% when the trailing 12-month default rate is closer to 4.5%. However, it is the technicals, with a structural excess demand and particularly in the HY market. And that does not look like changing anytime soon. For example, looking at the bond auctions this week in both the US and Europe, all issuance of note was characterised by very significant oversubscription. And this comes in a week that, for example, in Europe was the biggest on record.
As we noted last week, there is a mountain of money going into new issuance. In recent weeks, US and European companies have raced to issue debt looking to seize on the risk on mood in markets after the easing of US and China trade tensions.
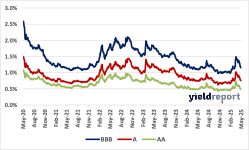
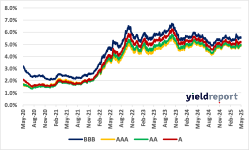
Figure 1:US Investment Grade Bonds Effective Yields Figure 2: US Investment Grade Bonds OAS Spreads.
Figure 3: US High-Yield Bonds Effective Yields. Figure 4: US High-Yield Bonds OAS Spreads
Figure 5: ITRAXX Australia – CDS Index Figure 6: Australian Swap to Bond Spreads