| Close | Previous Close | Change | |
|---|---|---|---|
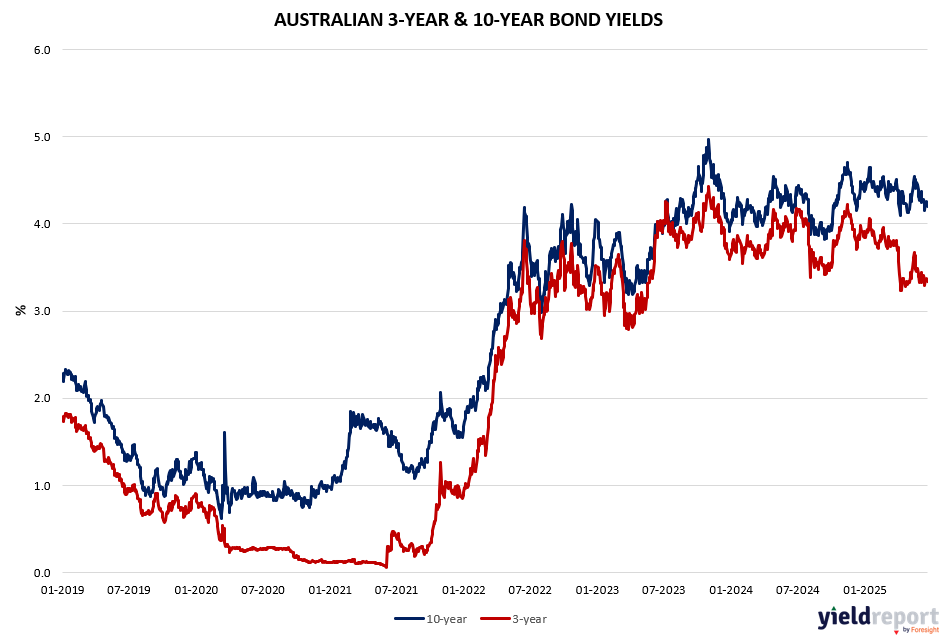
| Australian 3-year bond (%) | 3.335 | 3.356 | -0.021 |
| Australian 10-year bond (%) | 4.204 | 4.221 | -0.017 |
| Australian 30-year bond (%) | 4.907 | 4.916 | -0.009 |
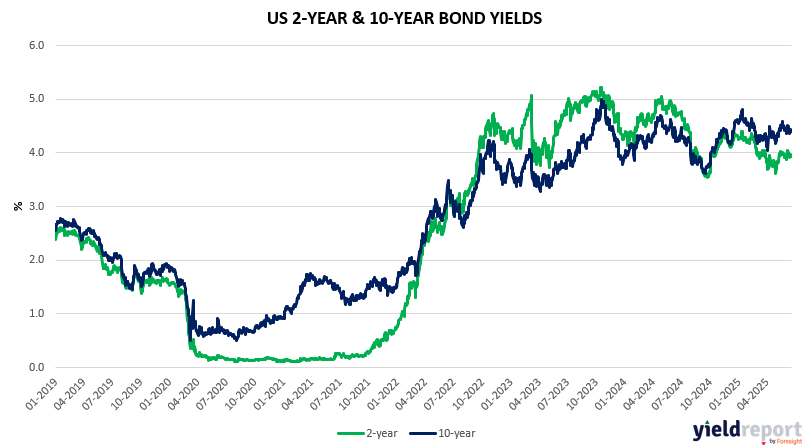
| United States 2-year bond (%) | 3.948 | 3.941 | 0.007 |
| United States 10-year bond (%) | 4.399 | 4.395 | 0.004 |
| United States 30-year bond (%) | 4.8948 | 4.896 | -0.0012 |
Overview of the Australian Bond Market
The Australian bond market continued its recent trend of softening yields on 20 June, reflecting a cautious but steady investor sentiment ahead of key economic data releases. The 10-year bond yield eased to 4.22%, down 3.3 bps from the previous session 1. The 3-year government bond yield slipped to 3.36%, a modest decline of 1.4 bps. The longer dated 20-year bond yield declined to 4.82%, a 0.04 percentage point drop from the previous day, while the 30-year bond yield also softened, settling at 4.92%, down 3.7 bps.
This across-the-curve decline suggests a market in a holding pattern, with investors positioning defensively amid expectations of a potential pivot by the Reserve Bank of Australia (RBA). The Bloomberg AusBond Composite Index ticked up by 0.09%, continuing its gradual rally. This indicates cautious optimism, with investors favouring fixed income as they await clearer signals from both domestic and global central banks.
Markets are increasingly pricing in a 90 basis point rate cut over the next year, targeting a 2.85% cash rate. However, no aggressive moves are being made yet—investors are largely in a wait-and-see mode for further developments on tariffs and geopolitical fronts.
Overview of the US Bond Market
The yield on 10-year Treasurys held roughly steady after Fed officials left interest rates unchanged and signalled that they were open to cutting rates in the second half of the year. The 10-year yield settled Friday at 4.374%, according to Tradeweb
Demand for U.S. government debt remains resilient, pushing Treasury yields to a second consecutive weekly decline. Monetary policy is little changed after the Fed meeting. Chair Powell will address lawmakers Tuesday in the House and Wednesday in the Senate. Investors will likely tune in for clues on the Fed’s next moves.
Meanwhile, markets brace for potential escalation of the Iran-Israel conflict, which could trigger flights for safety. GDP and PCE inflation reports are due late next week. The 10-year falls 0.048 percentage point to 4.374% and the two-year sheds 0.051 p.p. to 3.907%.
Weaker-than-expected Philadelphia Fed business activity index saps some momentum from Treasury yields, which are rising as U.S. markets reopen after the Juneteenth holiday. The indicator was a negative 0.4, unchanged from May. Economists surveyed by WSJ expected a negative 0.2. The Fed left the monetary policy outlook basically unchanged Wednesday and markets are still mostly pricing two cuts this year. The 10-year is at 4.437% and the two-year at 3.949%.
The latest U.S. industrial production data for May 2025 showed Total Industrial Production Index: 103.6 (2017 = 100) while the month-over-month change was –0.2% and Year-over-year change was +0.6% .
Within Manufacturing sector, monthly change: +0.1% and Year-over-year: +0.5%. Within the Mining sector, the monthly change: +0.1% and year-over-year: +2.9%.
Within Utilities sector, the monthly change was –2.9% and year-over-year: –1.6
Overall, the Industrial production slightly declined in May, mainly due to a drop in utility output. Manufacturing remained stable, while mining continued to show strength. Capacity utilization remains below long-term averages, suggesting some slack in the industrial sector.