Summary:
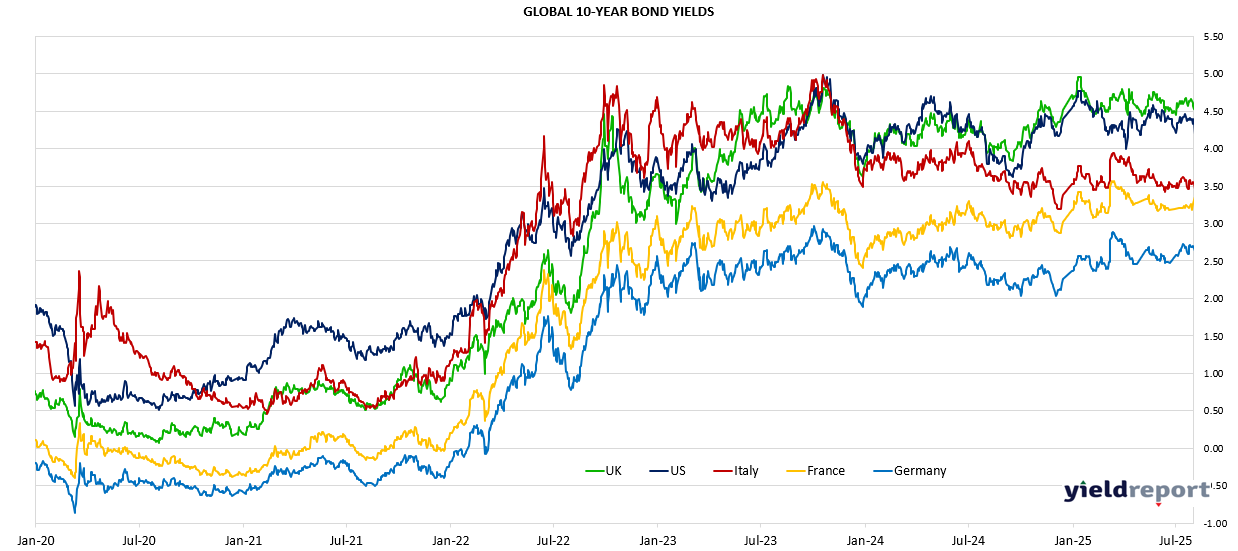
Bond markets across Australia and the U.S. rallied as yields fell sharply, signalling rising investor caution and expectations of policy easing. In Australia, the RBA cash rate held steady at 3.60%, but the 3-month BBSW slipped to 3.57%, while government bond yields tumbled across maturities — the 3-year yield dropped 28 bps to 3.31%, 10-year fell 27 bps to 4.10%, and 30-year eased 17 bps to 4.84%. In the U.S., Treasury yields also declined, with the 2-year at 3.43%, 10-year at 3.98%, and 30-year at 4.58%, as markets priced in the likelihood of slower global growth and future rate cuts.
Domestically, attention turned to Australia’s weakening labour market, with unemployment rising to 4.5% in September from 4.2%, reflecting higher workforce participation. This softening has eased concerns about wage-driven inflation, prompting markets to assign a 75% probability to an RBA rate cut in November. Governor Michele Bullock reiterated that the current stance is “a little on the tight side,” consistent with a neutral rate between 3% and 3.25%.
A dovish pivot by the RBA could relieve pressure on indebted households, corporate borrowers, and property markets, where signs of stabilisation are emerging. However, global uncertainties — particularly the escalating U.S.–China trade tensions over rare earths — continue to cloud the economic outlook.
The Australian Bond spreads (3 & 10 years) continue to indicate a positive sloping yield curve with significant steepening in the curve occurring from July 2023 (phase 1) and then accelerating from July 2024. The current spread continues to be at cyclical highs, although lower than record highs observed in 2021. From an investment perspective, steepening yield curves and a rebounding lending environment are likely to boost the domestic economic environment and bank profitability. In a similar vein, the spread between the US 2 year bonds and the US 10 Year bond has also been steepening since July 2023.
Figure 1: Aust. 3 yr minus 10 yr Bond Spread
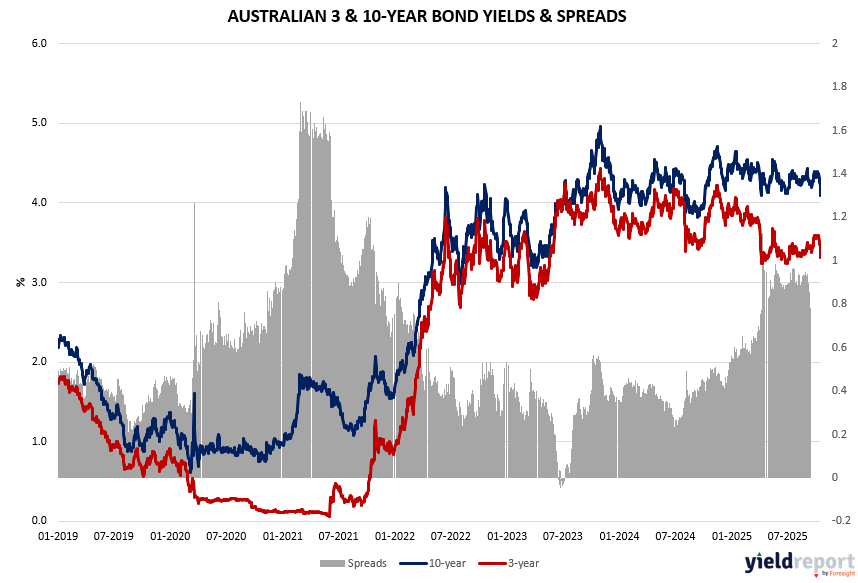
Figure 2: Australian & US Bond Yields
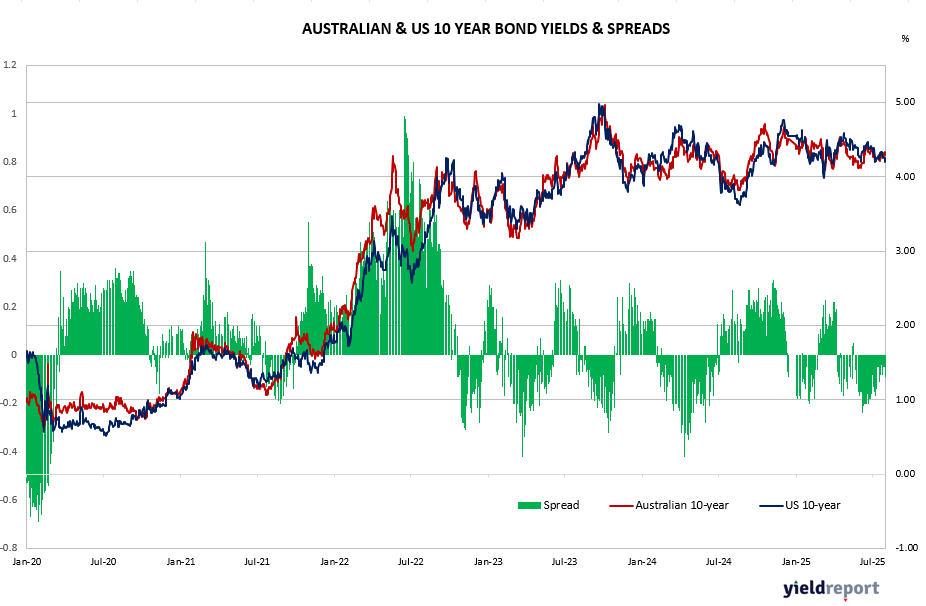
Figure 3: US 10-year minus 2-year Bond Spread