
Summary
The 43-day U.S. government shutdown, the longest in modern American history, created one of the most significant fiscal-liquidity shocks in recent decades. Beyond the political stalemate, the shutdown reshaped money-market dynamics, disrupted federal payments, affected economic data collection, pressured the U.S. dollar funding system, distorted expectations for Federal Reserve policy, and reverberated through global financial markets. As the shutdown advanced, liquidity conditions deteriorated sharply—even as equities initially remained resilient—ultimately putting pressure on policymakers to engineer a bipartisan resolution. The episode highlighted the fragility of the U.S. funding ecosystem at a time when federal deficits remain elevated, the Treasury General Account (TGA) has swollen, and the Federal Reserve is nearing the end of its quantitative tightening cycle.
The 43-Day U.S. Government Shutdown: Economic & Market Impact
- Political Origins and Structural Drivers of the Shutdown
The shutdown resulted primarily from a failure to pass appropriations bills in Congress, driven by disputes over spending levels, fiscal governance, and administrative powers. As departments ran out of authorised funding, non-essential federal operations ceased while essential workers continued without pay. Although shutdowns are not uncommon, this one was historically long, coinciding with a period of heightened market sensitivity around Treasury supply, liquidity conditions, and monetary policy.
What made this shutdown uniquely impactful was its timing:
- It overlapped with year-end funding pressures, typically a period of tight liquidity.
- It occurred during an elevated deficit year, requiring heavy Treasury bill issuance.
- It coincided with the Fed’s late-stage quantitative tightening (QT), which had already drained $1 trillion of reserves from the banking system since 2022.
- It halted key government outflows, causing the Treasury General Account to balloon at an unprecedented pace.
Collectively, these factors amplified a routine political dispute into a systemic liquidity event with global consequences.
- The Shutdown’s Most Acute Impact: A Liquidity Vacuum
TGA Surge and Reserve Drain
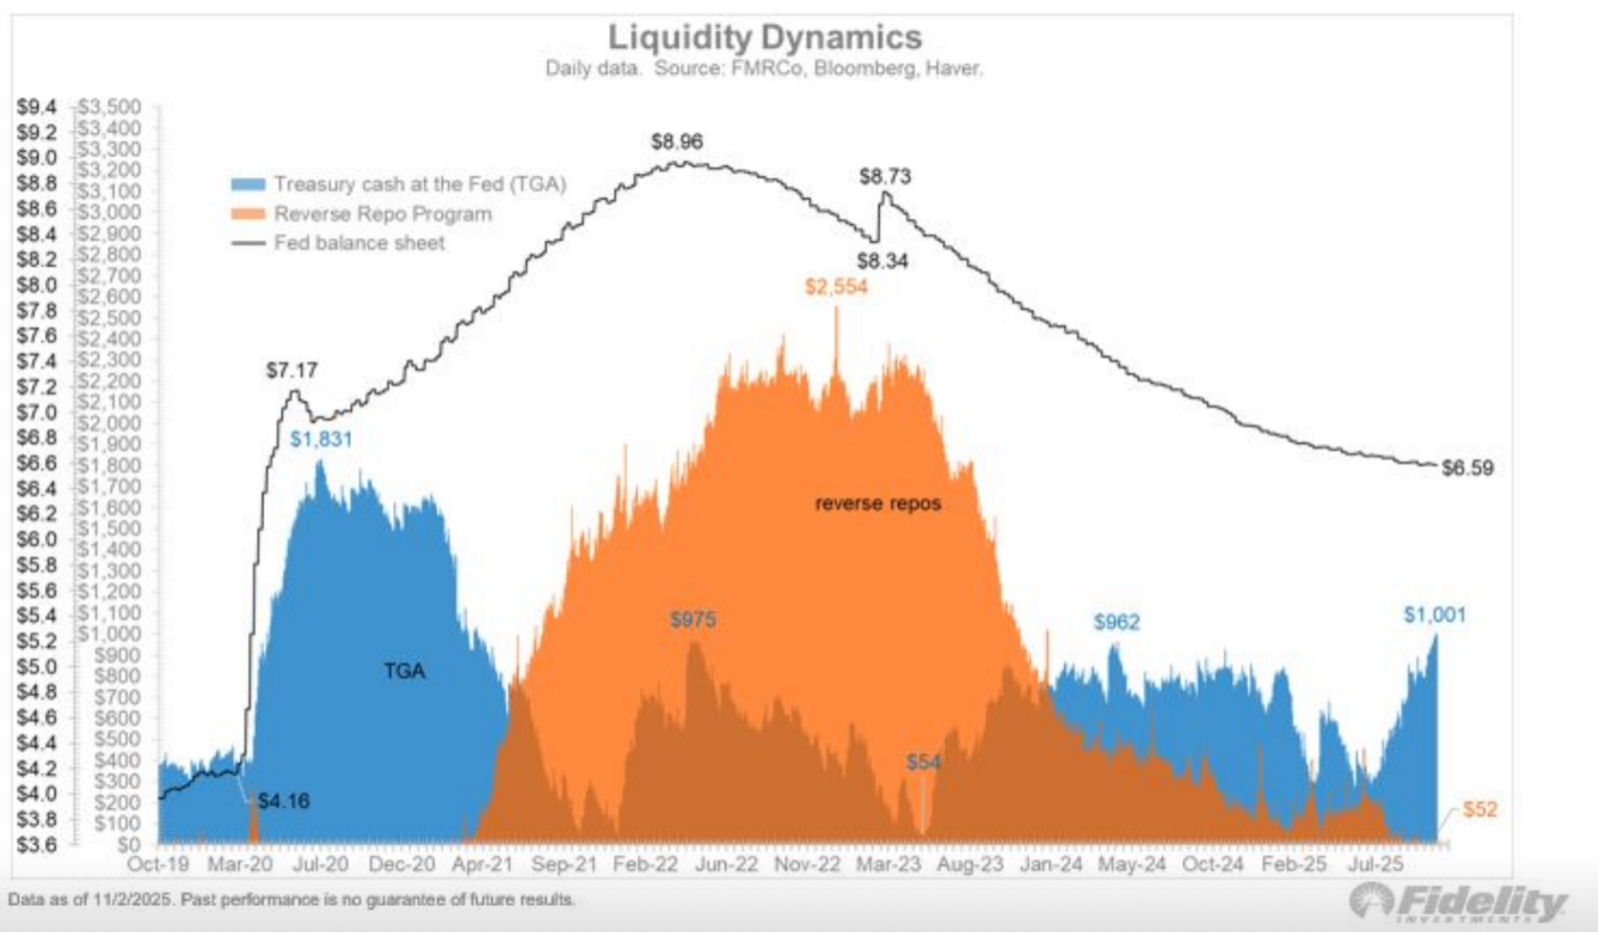
During the shutdown, the Treasury General Account (TGA) climbed to almost $1 trillion, rising over $200 billion in three weeks (). Because the shutdown halted federal spending while taxes and tariffs were still collected, cash flowed into the government but not out. Every dollar absorbed by the TGA is a dollar drained from private-sector bank reserves.
This created a two-layered liquidity vacuum:
- Reserves were pulled from the banking system.
- Collateral availability remained high, but cash became scarce.
In financial plumbing terms, this is the worst combination: abundant Treasury supply but insufficient cash to finance it, forcing institutions to bid aggressively for short-term dollars.
Exhibit 1- Funding Stress in Repo Market & TGA Balance
- Money Market Stress: The SOFR-IORB Spread Explosion
The clearest indicator of stress was the blowout in the SOFR-IORB spread, which surged to 32 basis points—its widest point since the March 2020 crisis (). SOFR (the Secured Overnight Financing Rate) represents the cost of borrowing overnight cash against Treasury collateral, while the Interest on Reserve Balances (IORB) represents the Fed’s risk-free floor.
A widening spread indicated dollar scarcity so severe that banks were paying above-policy rates to obtain cash overnight. This type of dislocation is extremely rare outside crisis periods.
Additional funding pressures included:
- Month-end and quarter-end rebalancing, which already tighten liquidity by 10–20 bps in normal times but were amplified by the shutdown.
- Record usage of the Fed’s Standing Repo Facility (SRF), which surged to $50.4 billion on October 31 before falling as conditions stabilised ().
- A sharp drop in Reverse Repo Facility (ON RRP) balances, indicating money market funds were withdrawing and redirecting cash to meet their own liquidity needs.
These dynamics show that the shutdown directly caused funding market dysfunction, raising the risk of broader credit tightening.
Exhibit 2: Liquidity Dynamics and Fed Balance Sheet
- Treasury Debt Issuance: Collateral Flood Meets Cash Scarcity
Paradoxically, even as cash was becoming scarce, Treasury issuance accelerated. More than $500 billion of new T-bills were issued during the shutdown (). Ordinarily, new issuance is easily absorbed by banks, insurers, and money funds. But because cash was trapped in the TGA, institutions were forced into a “collateral transformation loop”:
- Buy Treasuries → drains liquidity
- Repo Treasuries to obtain cash → drains more liquidity
- Repo rates rise sharply → SOFR spikes
This spiral represented a double tightening on the system. The shutdown of government spending meant the Treasury involuntarily acted as a massive liquidity sponge.
- Impacts on the U.S. Dollar, Fed Expectations, and Bond Markets
Dollar Strengthening
The DXY dollar index climbed to 100.22 during the stress episode. With dollar liquidity tightening, short-term rates rose, strengthening the USD through both:
- the interest rate channel (higher returns on US cash), and
- safe-haven demand (during financial system stress).
Fed Policy Repricing
The market had initially priced a ~94% probability of a December rate cut. As liquidity tightened, that probability fell to ~65–67%, because:
- money market stress mimicked a rate hike,
- The Fed signalled caution about cutting into a dysfunctional market,
- Labour data remained stable despite AI adoption concerns.
As a result, bond yields rose, reflecting reduced expectations of near-term easing.
Treasury Market Reactions
10-year yields oscillated around 4.30%, balancing:
- upward pressure from liquidity tightening and heavy issuance
- downward pressure from safe-haven flows
Exhibit 3: Fed December Rate Cut Probability 
- Equity Market Impacts: Volatile but Positioned for a Rebound
At the height of the shutdown:
- The S&P 500 fell −1.63% for the week, weighed by a −4.24% decline in tech ().
- Nasdaq experienced its worst week since April.
However, the broader market narrative was less pessimistic than the funding markets because investors anticipated:
- a near-term shutdown resolution
- Fed support if systemic stress worsened
- a liquidity surge once the TGA unwound
Indeed, markets rallied sharply when a bipartisan Senate bill broke the impasse. S&P 500 futures surged, approaching record highs as investors priced in a $1 trillion liquidity wave expected to enter the system once government spending resumed (). This helped set up expectations for a strong year-end rally.
- Impacts on Economic Data, Federal Operations, and GDP
Short-term GDP drag
Each week of shutdown typically subtracts ~0.1–0.2 percentage points from quarterly GDP due to stalled federal operations. A 43-day shutdown likely shaved 0.6–0.8 percentage points from near-term GDP.
Major disruptions included:
- Delayed CPI release because government statisticians were furloughed
- Slowdown in federal contracting, affecting construction, technology, and defence
- Delayed agricultural, energy, and trade data, reducing visibility for businesses
- Reduced federal consumption expenditure, directly lowering GDP
The Cleveland Fed’s high-frequency inflation models continued operating, projecting soft inflation during the period, but the shutdown created uncertainty around data reliability.
- Labour Market and Corporate Impacts
Despite fears that AI adoption would weaken jobs, private data showed resilience. Employment remained in the “balanced” range of 32k–82k monthly additions, enough to stabilise unemployment.
Shutdown-driven impacts on labour markets included:
- Federal workers missing pay checks, reducing consumption
- Delays in immigration and work visa processing, tightening labour supply further
- Contractor disruption, affecting tech, consulting, and defence firms
However, the private sector remained steady enough that the shutdown did not trigger broader labour-market deterioration.
- Resolution and Forward Outlook
A bipartisan bill passed the Senate (60–40) and was expected to move quickly through the House. The bill funded government operations into early 2026 and limited federal worker terminations.
Most importantly, the end of the shutdown meant:
- TGA would fall from ~$1 trillion toward normal levels (~$750–800B)
- Liquidity would flow back into bank reserves and repo markets
- Funding stress would ease as reserves rebounded
- The Fed’s December end to QT would stabilise the reserve base
These developments supported the view that the shutdown’s financial distortions were severe but temporary, with markets poised for a liquidity-driven rebound once government spending resumed.
Conclusion
The 43-day shutdown evolved from a political impasse into a systemic liquidity event that strained the U.S. financial system. The surge in the TGA, collapse in reserves, SOFR spikes, and stressed repo markets highlighted the sensitivity of the modern dollar system to fiscal disruptions. While economic growth slowed and data collection faltered, the more profound impact occurred in money markets, where shutdown-induced liquidity withdrawal triggered the sharpest funding stress since early 2020.
Yet, markets ultimately looked through the short-term pain. The anticipated release of nearly $1 trillion of liquidity, combined with the Fed’s end to QT, set up the possibility of a powerful year-end rally—demonstrating how fiscal dysfunction and monetary plumbing dynamics are now deeply intertwined in shaping market behaviour.