
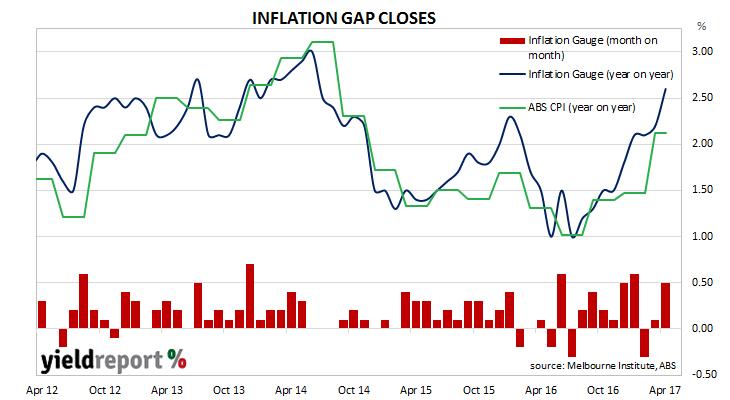
The Melbourne Institute’s Inflation Gauge is an attempt to replicate the ABS consumer price index (CPI) on a monthly basis instead of a quarterly one. It has turned out to be a reliable leading indicator of the CPI, although there are periods in which the Inflation Gauge series and the CPI have diverged, only for the two series to eventually realign over the space of six to twelve months.
During April, the Inflation Gauge jumped by 0.5% and by 2.6% over the last 12 months. March’s comparable figures were 0.1% and 2.2%. Core measures of inflation, such as the Melbourne Institute’s version of “trimmed mean” moved up from 1.6% (year on year) to 1.7%.
Unlike previous months where retail sales and job advertisement figures were released on the same day, the latest inflation gauge figures were published in the absence of any other major economic data releases. Yields on 3 year bonds edged up 1bps to 1.84% while 10 year bonds finished the day steady at 2.61%.
In February’s report, the chart was labelled “Inflation up or false dawn?” The sizeable gap which has existed in February closed after March quarter CPI figures moved higher. These latest Inflation Gauge figures suggest inflation, as measured by consumer prices, is likely to rise after another gap has opened between the two series.