Yield curves: the best predictor of recession

13 April 2018

A yield curve is simply a series of points on a chart. Each point represents a bond’s yield against its time to maturity, or term, for a given borrower. A yield curve can be constructed for a given borrower, such as the Federal Government or a particular company, such as BHP. Quite often, a yield curve is constructed for a selection of borrowers, especially when they have the same credit rating.

Most of the time, a yield curve has a positive gradient; it slopes upwards from left to right. As a general rule, market participants “agree” loans for longer terms should have a higher rate of interest.  
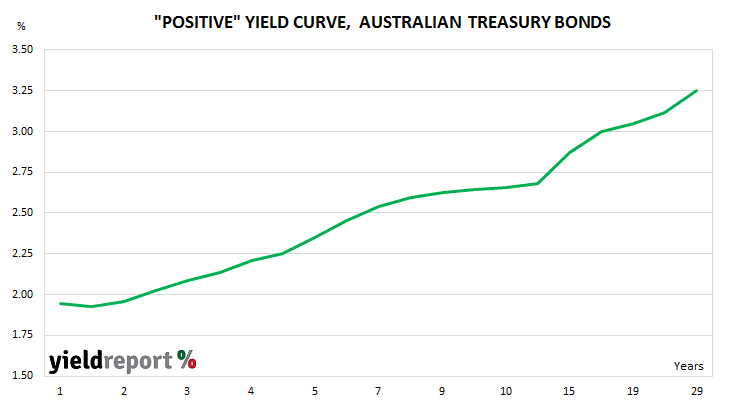
However, there have been some periods in the past where the slope is flat or indeed negative. A negative yield curve still slopes up but from right to left. A negative yield curve may also be referred to as “inverted”.

The relationship between inverted yield curves and recessions has been noted for decades. Some consider the relationship to be more of a rule of thumb than anything but there are others who place more importance on it.

Michael Bauer and Thomas Mertens are research advisers at the Economic Research Department of the Federal Reserve Bank of San Francisco and recently they wrote a paper regarding “term spread”, which is “the difference between long-term and short-term interest rates”.

A “spread” is simply the difference between two prices or, in this case, two yields. Rather than showing multiple points on a chart (as above), often just two points are selected. The difference between the points is the spread. In the chart above, the yield of the 3 year (May 2021) government bond is 2.09%, the yield of the 10 year (May 2028) government bond is 2.73% and hence the spread is 0.68% or 68 basis points (bps).

Right at the very beginning of their paper, they get to the heart of the matter. “Every U.S. recession in the past sixty years was preceded by a negative term spread, that is, an inverted yield curve.”

Does a recession always follow each period in which short term rates exceed long term rates? No, but “a negative term spread was always followed by an economic slowdown and, except for one time, by a recession.”

Recessions are defined as two consecutive quarters of negative GDP growth. Agreement with this definition is far from widespread (per capita GDP growth may be more appropriate) but for now, it is the generally-accepted standard.

How reliable is the yield curve as a predictor? According to the authors, a negative term spread or inverted yield curve is a very good predictor. “A simple rule of thumb that predicts a recession within two years when the term spread is negative has correctly signalled all nine recessions since 1955 and had only one false positive, in the mid-1960s, when an inversion was followed by an economic slowdown but not an official recession.”

Flat yield curves or yield curves which have a very slight positive slope are not a cause for concern. It is another matter once a yield curve turns negative. “There appears to be something special about a negative term spread and yield curve inversions, both for predicting recessions and, according to additional analysis, for predicting output growth. The implication is that a negative term spread is much more worrisome for the economic outlook than a low but positive term spread.”

Low interest rates don’t have any effect either. U.S. bond yields reached levels in 2016 perhaps not seen since the 1800s. The authors address the consequences of a low interest rate environment. “The argument goes that increases in the short-term policy rate may slow down the economy less than usual in such an environment.” Their numbers do not agree. “While these hypotheses have some intuitive appeal, our analysis shows that they are not substantiated by a statistical analysis that incorporates the suggested factors into the type of predictive models we use.”

The yield curve as a recession predictor is not without its critics. One criticism relates to time period from which the authors took data. From 1955 to the present sounds impressive but is this period representative of all periods? The other criticism is the “within two years” qualification which, for some people, seems a little on the excessive side. However, the fact an inverse yield curve does not have a perfect record as a predictor given it has provided one false positive among nine recessions means it is still worthy of respect.

 The paper’s conclusion is the “term spread has a strikingly accurate record for forecasting recessions. Periods with an inverted yield curve are reliably followed by economic slowdowns and almost always by a recession.” The authors warn readers who think the unprecedented level of central bank intervention over the last decade has produced conditions which have not been previously witnessed. “While the current environment appears unique compared with recent economic history, statistical evidence suggests that the signal in the term spread is not diminished.”