
Summary: US output recovers a little; gain less than expected; figures just under April numbers before revisions; capacity usage increases modestly.
The Federal Reserve’s industrial production (IP) index measures real output from manufacturing, mining, electricity and gas company facilities located in the United States. These sectors are thought to be sensitive to consumer demand and so some leading indicators of GDP use industrial production figures as a component. Figures from early-2020 had been suggestive of a possible end to a downtrend which began in late-2018, only to collapse through March and April.
According to May’s figures, US industrial production expanded by 1.4%. The result was lower than the 3.0% increase which had been expected but it was a vast improvement on April’s revised figure of -12.5%. On an annual basis, the growth rate increased ever so slightly from April’s revised figure of -16.2% to -15.3%.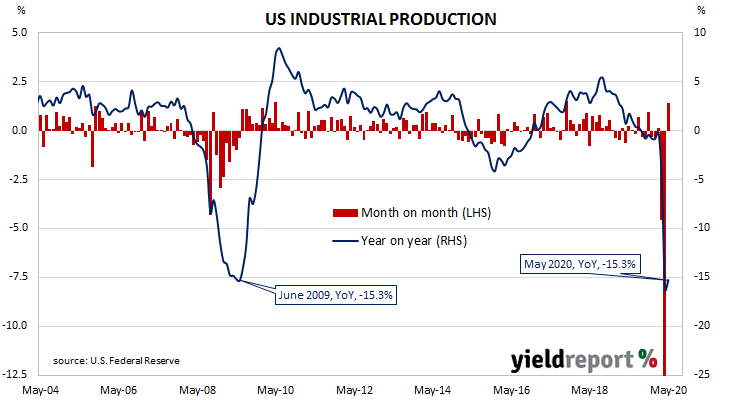
The report came out on the same day as May’s retail sales report. US Treasury bond yields finished higher, especially at the ultra-long end. By the end of the day, the US 2-year Treasury yield remained unchanged at 0.20% while the 10-year yield had gained 2bps to 0.75% and the 30-year yield had jumped 9bps higher to 1.55%.
In terms of US Fed policy, expectations of any change in the federal funds rate over the next 12 months retained an easing bias. OIS contracts from July onwards continued to imply some chance of a move to a zero effective federal funds rate.
The same report includes US capacity utilisation figures which are generally accepted as an indicator of future investment expenditure and/or inflationary pressures. Capacity usage had hit a high for this business cycle in early 2019 before it began a downtrend. April’s figure hit a multi-decade low at 64.0% after revisions but May’s reading recovered to 64.8%, a fraction under April’s preliminary figure of 64.9%.