
By Chris Owens, Analyst, Atchison Consultants
Australian real estate investment trusts (AREITs), as represented by the S&P/ASX 200 REITs Index, returned
-1.4% in the month ending 30 June 2020. The AREIT index underperformed the S&P/ASX 200 return of 2.6% over the month.
Over the 12 months to June 2020, AREITs posted a total return of -21.3% (18.7% lower than the S&P/ASX 200 return of 2.6%). This reflects a strong recovery of the ASX 200 over the June quarter, while AREITs have not recovered fully from the large fall in the month of March of 35.5%
Sector Performance
Table 1 below shows the performance of AREITs for various periods ending 30 June 2020.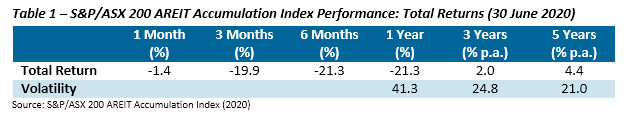 The restrictions arising from the pandemic have had a substantial impact on the medium-to-long term performance of the AREIT sector. Over the 3 years and 5 years to the end of June, the sector produced total returns of 2.0% and 4.4% per annum respectively.
Sector returns in June were led by Office AREITs with 6.0%, followed by Diversified AREITs with -1.3%, Industrial AREITs with -2.1% and Retail AREITs with -3.4%. The returns from Office AREITs reflect recoveries after steep declines in May. Industrial AREITs saw a decline in returns after surging 16.7% in April. Office REITs appear to have made some recovery.
Table 2 below shows the income performance of AREITs for various periods ending 30 June 2020.
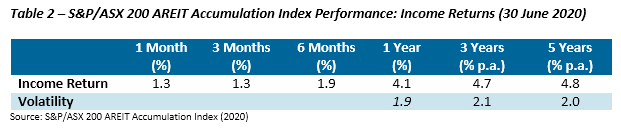
The income component of the total return was 4.1% for the 12-month period to June 2020. The annual volatility of income returns was 1.9%, which is low when compared with other asset classes.
The AREIT sector was trading at an earnings yield of approximately 7.1%, which was significantly higher than yields of both cash and Commonwealth Government bond. Australian 10 year government bond yields currently sit at 0.87%. The drop in the cash rate target to 0.25% along with the RBA’s 3 year target yield has widened the gap between the earnings yield of the AREIT sector and Commonwealth Government bonds.
The change over time of the spread between the earnings yield of AREITs and the 10-year government bond yield is shown in Chart 1.