
Summary: US output increases for a second consecutive month; gain higher than expected; capacity usage increases but still at GFC levels.
The Federal Reserve’s industrial production (IP) index measures real output from manufacturing, mining, electricity and gas company facilities located in the United States. These sectors are thought to be sensitive to consumer demand and so some leading indicators of GDP use industrial production figures as a component.
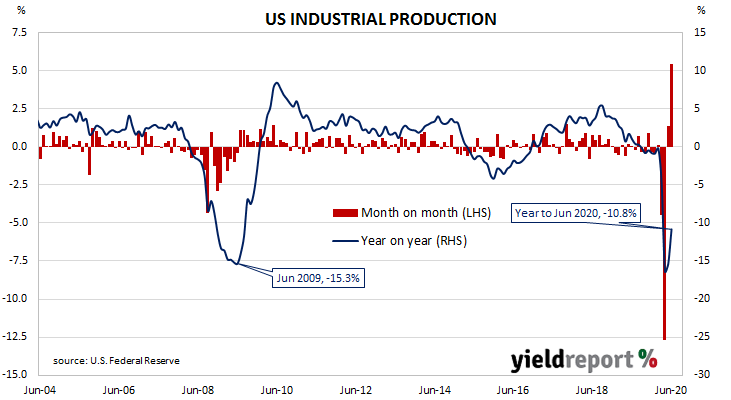
Figures from early-2020 had been suggestive of a possible end to a downtrend which began in late-2018, only to collapse through March and April.
According to June’s figures, US industrial production expanded by 5.4%, seasonally adjusted. The result was greater than the 4.8% increase which had been expected and significantly higher than May’s revised figure of 1.4%. On an annual basis, the growth rate increased from May’s revised figure of -15.4% to -10.8%.
US Treasury bond yields barely moved. By the end of the day, the US 2-year Treasury yield had slipped 1bp to 0.16% while 10-year and 20-year yields had each inched up 1bp to 0.63% and 1.33% respectively.
In terms of likely US monetary policy, expectations of any change in the federal funds rate over the next 12 months remained negligible. OIS contracts for July implied an effective federal funds rate of 0.079%, just over 2bps below the current spot rate.
The same report includes US capacity utilisation figures which are generally accepted as an indicator of future investment expenditure and/or inflationary pressures. Capacity usage had hit a high for this business cycle in early 2019 before it began a downtrend which ended with April’s multi-decade low of 64.2%. June’s reading extended on the previous month’s recovery; capacity utilisation increased from May’s revised figure of 65.2% to 68.6%.