
Summary: US output expands; rise just above expected figure; capacity utilisation rate increases.
The Federal Reserve’s industrial production (IP) index measures real output from manufacturing, mining, electricity and gas company facilities located in the United States. These sectors are thought to be sensitive to consumer demand and so some leading indicators of GDP use industrial production figures as a component.
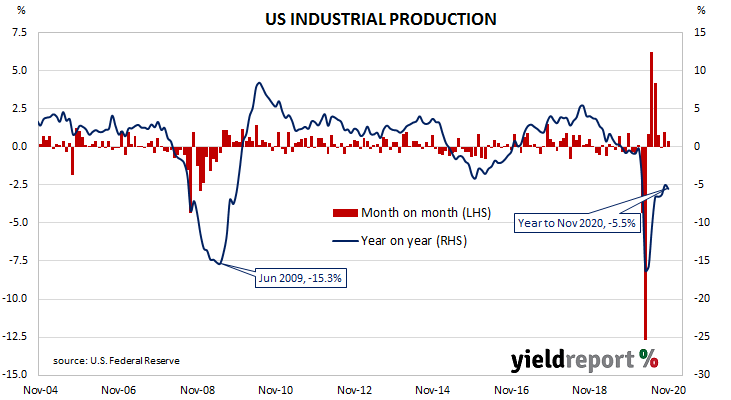
Production began recovering in May and subsequent months after collapsing through March and April.
US industrial production expanded by 0.4% on a seasonally adjusted basis in November. The result was a little over the 0.3% increase which had been generally expected but just under half of October’s 0.9% rise after it was revised down from 1.1%. On an annual basis, the contraction rate increased from October’s revised figure of -5.0% to -5.5%.
The same report includes US capacity utilisation figures which are generally accepted as an indicator of future investment expenditure and/or inflationary pressures. Capacity usage had hit a high for the last business cycle in early 2019 before it began a downtrend which ended with April’s multi-decade low of 64.2%. November’s reading increased to 73.3% from October’s revised figure of 73.0%.