
Summary: Prices received by producers jump in January; increase well above expectations; “core” PPI also jumps; higher core rate raises concerns of “mounting pipeline inflation pressures”; US bond yields down among flurry of data, FOMC minutes.
Around the end of 2018, the annual inflation rate of the US producer price index (PPI) began a downtrend which then continued through 2019. Months in which producer prices increased suggested the trend may have been coming to an end, only for it to continue, culminating in a plunge in April. Figures from subsequent months suggest a return to “normal” may be taking place.
The latest figures published by the Bureau of Labor Statistics indicate producer prices leaped by 1.3% after seasonal adjustments in January. The increase was well above the 0.4% rise which had been generally expected and much higher than December’s 0.3% rise. On a 12-month basis, the rate of producer price inflation after seasonal adjustments increased from 0.7% to 1.8%.
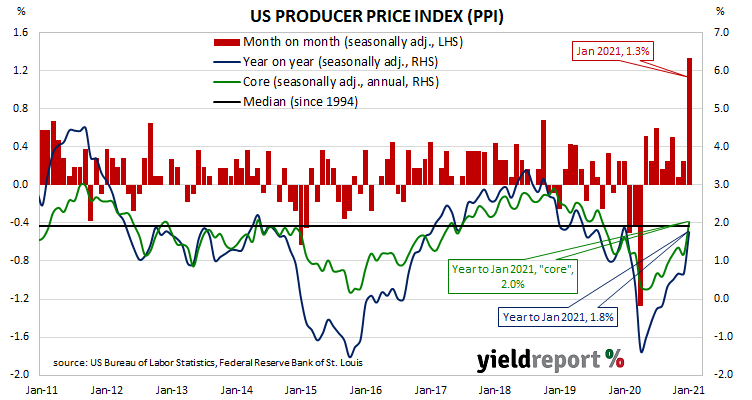
PPI inflation excluding foods and energy rose by 1.2% after recording a 0.1% decline in November and a 0.1% increase in December. The annual rate accelerated from 1.2% in December to 2.0%.
ANZ economist Daniel Been said the rise in the core rate raised “concerns about mounting pipeline inflation pressures.”
The report was released on the same day as January industrial production report, January retail sales numbers and the minutes of the FOMC’s January meeting. Despite the robust figures, US Treasury bond yields moved lower across the curve, aided by a paragraph in the minutes which stressed the need to “abstract from temporary factors affecting inflation”. By the end of the day, the 2-year Treasury yield had shed 2bps to 0.10%, the 10-year yield had lost 4bps to 1.27% while the 30-year yield finished 5bps lower at 2.04%.