
Summary: ISM purchasing managers index (PMI) up; above consensus expectation; focus on higher “prices paid” component; other sub-indices also strong; signs of supply chain bottlenecks; US economy growing at solid pace.
US purchasing managers’ index (PMI) readings reached a cyclical peak in September 2017 before they started a downtrend which stabilised in late 2019 after a truce of sorts was made with the Chinese regarding trade. The ISM report from March 2020 signalled a contraction in US manufacturing activity had begun and it stayed in this state until June. Subsequent month’s readings implied growth of the US manufacturing sector had resumed.
According to the latest Institute of Supply Management (ISM) survey, its Purchasing Managers Index recorded a reading of 60.8% in February. The result was above the generally expected figure of 58.8% and higher than January’s reading of 58.7%. The average reading since 1948 is 52.9% and any reading above 50% implies an expansion in the US manufacturing sector relative to the previous month.
NAB economist Tapas Strickland paid particular attention to the prices paid sub-index which “rose to its highest level since 2008 to 86.0 from 80.0” while noting the new orders, production and employment sub-indices “were also strong”. He described an increase in supplier delivery times as “a sign of supply chain bottlenecks and potentially a source of higher temporary inflationary pressure.”
Ultra-long US Treasury bond yields increased noticeably on the day while shorter-term yields remained almost stable. By the close of business, the 2-year Treasury bond yield remained unchanged at 0.12%, the 10-year yield had slipped 1bp to 1.43% while the 30-year yield finished 6bps higher at 2.20%.
Purchasing Managers’ Indices (PMIs) are economic indicators derived from monthly surveys of executives in private-sector companies. They are diffusion indices, which means a reading of 50% represents no change from the previous period, while a reading under 50% implies respondents reported a deterioration on average. According to the ISM, a reading “above 42.8%, over a period of time, generally indicates an expansion of the overall economy,”
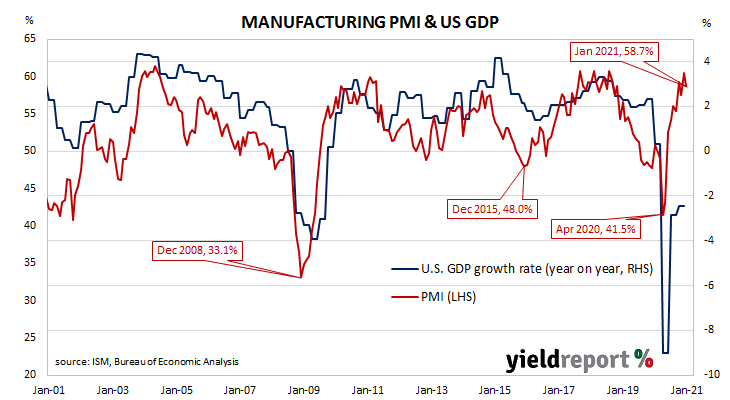
Manufacturing PMI figures appear to lead US GDP by several months despite a considerable error in any given month. The chart below shows US GDP on a “year on year” basis (and not the BEA annualised basis) against US GDP implied by monthly PMI figures.