
Summary: ISM purchasing managers index (PMI) slightly lower; below consensus expectation; indicates “strong sector expansion and U.S. economic growth”; supply squeeze may have peaked; implies US economy still growing at rapid pace.
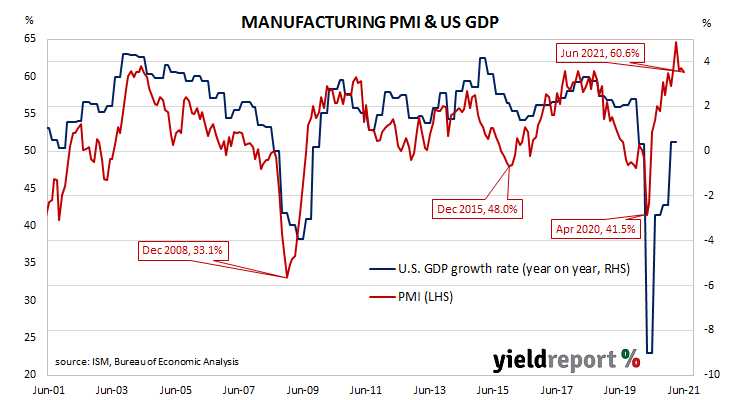
US purchasing managers’ index (PMI) readings reached a cyclical peak in September 2017. They then started a downtrend which ended in March 2020 with a contraction in US manufacturing which lasted until June 2020. Subsequent month’s readings implied growth had resumed before becoming stronger through the early months of 2021.
According to the latest Institute of Supply Management (ISM) survey, its Purchasing Managers Index recorded a reading of 60.6% in June. The result was slightly below the generally expected figure of 61.0% and slightly lower than May’s reading of 61.2%. The average reading since 1948 is 52.9% and any reading above 50% implies an expansion in the US manufacturing sector relative to the previous month.
The ISM’s Timothy Fiore said, “The Manufacturing PMI continued to indicate strong sector expansion and U.S. economic growth in June.”
Longer-term US Treasury bond yields declined modestly on the day. By the close of business, the 10-year Treasury bond yield had slipped 1bp to 1.46% and the 30-year yield had shed 2bps to 2.07%. The 2-year yield finished 1bp higher at 0.26%.
NAB currency strategist Rodrigo Catril described US manufacturing as being at a “very robust level” while noting supplier delivery times had eased, “hinting at the idea that maybe the US has reached a peak in the supply bottle neck squeeze…” However, he also said the current supply situation is “still a long way from normal.”
Purchasing managers’ indices (PMIs) are economic indicators derived from monthly surveys of executives in private-sector companies. They are diffusion indices, which means a reading of 50% represents no change from the previous period, while a reading under 50% implies respondents reported a deterioration on average. According to the ISM, a reading “above 42.8%, over a period of time, generally indicates an expansion of the overall economy.”
Manufacturing PMI figures appear to lead US GDP by several months despite a considerable error in any given month. The chart below shows US GDP on a “year on year” basis (and not the BEA annualised basis) against US GDP implied by monthly PMI figures.