
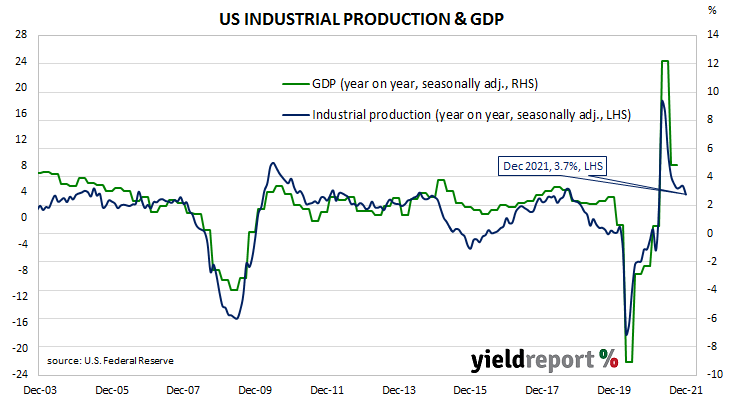
Summary: US industrial output down 0.1% in December, contrasts with 0.2% expected; up 3.7% over past 12 months; weakness driven by vehicles, parts; capacity utilisation rate down 0.1ppt to 76.5%; above February 2020 figure, still well short of long-term average.
The Federal Reserve’s industrial production (IP) index measures real output from manufacturing, mining, electricity and gas company facilities located in the United States. These sectors are thought to be sensitive to consumer demand and so some leading indicators of GDP use industrial production figures as a component.
US production collapsed through March and April of 2020 but then began recovering in subsequent months.
According to the Federal Reserve, US industrial production contracted by 0.1% on a seasonally adjusted basis in December. The result was in contrast to the 0.2% increase which had been generally expected as well as November’s 0.7% expansion. On an annual basis, the expansion rate slowed from November’s figure of 5.0% to 3.7%.
“The weakness in manufacturing was driven by a 1.3% drop in auto vehicles and parts,” said ANZ Head of Australian Economics David Plank.
US Treasury bond yields moved noticeably higher on the day. By the close of business, the 2-year Treasury yield had gained 7bps to 0.96%, the 10-year yield had added 9bps to 1.79% while the 30-year yield finished 8bps higher at 2.12%.
The same report includes US capacity utilisation figures which are generally accepted as an indicator of future investment expenditure and/or inflationary pressures. Capacity usage had hit a high for the last business cycle in early 2019 before it began a downtrend which ended with April 2020’s multi-decade low of 64.2%. December’s reading slipped from 76.6% to 76.5%, still above February 2020’s reading of 76.3% but still well short of the long-term average of 80.1%.
While the US utilisation rate’s correlation with the US jobless rate is solid, it is not as high as the comparable correlation in Australia.