
Summary: ISM PMI declines from 58.8% to 58.0% in January, essentially in line with consensus expectation; supply-chain issues continue; key measures of supply chain disruptions ease again; latest reading implies 4.2% 12-month US GDP growth rate in June.
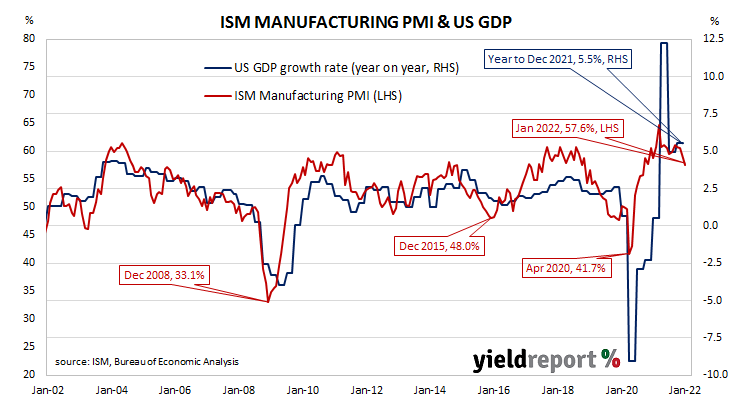
The Institute of Supply Management (ISM) manufacturing Purchasing Managers Index (PMI) reached a cyclical peak in September 2017. It then started a downtrend which ended in March 2020 with a contraction in US manufacturing which lasted until June 2020. Subsequent month’s readings implied growth had resumed, with the index becoming stronger through to March 2021. Since then, readings have remained at elevated levels despite recent declines.
According to the ISM’s January survey, its PMI recorded a reading of 57.6%, essentially in line with the generally expected figure of 58.0% but also a little lower than December’s 58.8%. The average reading since 1948 is 53.0% and any reading above 50% implies an expansion in the US manufacturing sector relative to the previous month.
Timothy Fiore, Chair of the ISM’s Manufacturing Business Survey Committee, said the US manufacturing sector continued to be constrained by supply-chain issues “but January was the third straight month with indications of improvements in labour resources and supplier-delivery performance.”
The report was released on the same day as the December JOLTS report but US Treasury yields were barely moved on the day. By the close of business, the 2-year Treasury bond yields had slipped 1bp to 1.17%, the 10-year yield had inched up 1bp to 1.80% while the 30-year yield finished unchanged at 2.12%.
In terms of US Fed policy, expectations for a higher federal funds rate over the next 12 months softened slightly. At the close of business, March contracts implied an effective federal funds rate of 0.22%, 14bps higher than the current spot rate while June contracts implied 0.665%. February 2023 futures contracts implied an effective federal funds rate of 1.345%, 126bps above the spot rate.
“Looking at some of the sub-indices, the key measures of supply chain disruptions eased again, notably the order backlogs index falling over 6 points to a 15-month low. Prices paid jumped nearly 8 points but this can be put down to the rise in oil prices,” said NAB currency strategist Rodrigo Catril.
Purchasing managers’ indices (PMIs) are economic indicators derived from monthly surveys of executives in private-sector companies. They are diffusion indices, which means a reading of 50% represents no change from the previous period, while a reading under 50% implies respondents reported a deterioration on average.According to the ISM’s latest announcement, a reading “above 48.7%, over a period of time, generally indicates an expansion of the overall economy.”
The ISM’s manufacturing PMI figures appear to lead US GDP by several months despite a considerable error in any given month. The chart below shows US GDP on a “year on year” basis (and not the BEA annualised basis) against US GDP implied by monthly PMI figures.
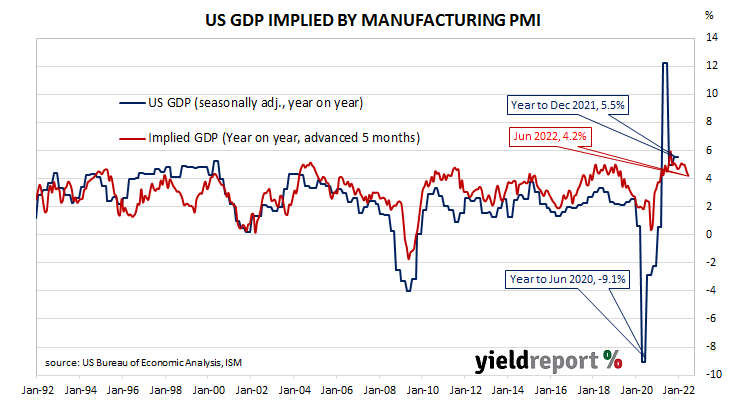
According to the ISM and its analysis of past relationships between the PMI and US GDP, January’s PMI corresponds to an annualised growth rate of 3.1%, or 0.8% over a quarter. Regression analysis on a year-on-year basis suggests a 12-month GDP growth rate of 4.2% five months after this latest report.
The ISM index is one of two monthly US PMIs, the other being an index published by IHS Markit. IHS Markit also produces a “flash” estimate in the last week of each month which comes out about a week before the ISM index is published. The IHS Markit January flash manufacturing PMI registered 55.0%, 2.7 percentage points lower than December’s final figure.