
Summary: ISM PMI down in June, below expectations; progress made on addressing moderate-term labour shortages at all tiers; “yet another piece of evidence that the US economy is slowing”; latest reading implies 3.1% 12-month growth rate in November.
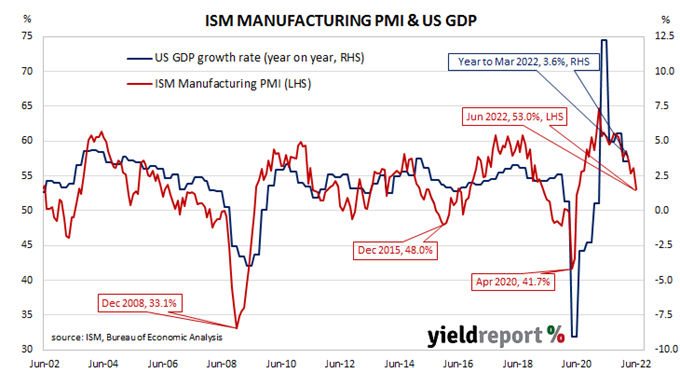
The Institute of Supply Management (ISM) manufacturing Purchasing Managers Index (PMI) reached a cyclical peak in September 2017. It then started a downtrend which ended in March 2020 with a contraction in US manufacturing which lasted until June 2020. Subsequent month’s readings implied growth had resumed, with the index becoming stronger through to March 2021. Since then, readings have remained at levels associated with solid economic growth despite some recent declines.
According to the ISM’s June survey, its PMI recorded a reading of 53.0%, below the generally expected figure of 55.4% and lower than May’s 53.6%. The average reading since 1948 is 53.0% and any reading above 50% implies an expansion in the US manufacturing sector relative to the previous month.
“The US manufacturing sector continues to be powered, though less so in June, by demand while held back by supply chain constraints,” said Timothy Fiore, Chair of the ISM’s Manufacturing Business Survey Committee. He noted respondents had pointed to progress “on addressing moderate-term labour shortages at all tiers of the supply chain…”
US Treasury yields fell materially on the day. By the close of business, the 2-year Treasury bond yield had dropped by 14bps to 2.83%, the 10-year yield had shed 13bps to 2.89% while the 30-year yield finished 7bps lower at 3.12%.
In terms of US Fed policy, expectations of higher federal funds rates over the next 12 months generally eased. At the close of business, July contracts implied an effective federal funds rate of 1.685%, 10bps higher than the current spot rate while September contracts implied a rate of 2.435%. June 2023 futures contracts implied 3.22%, 164bps above the spot rate.
“The softer ISM was yet another piece of evidence that the US economy is slowing, after the weaker than expected consumer and investment figures last week,” said NAB currency strategist Rodrigo Catril. “Importantly too, while the data is suggesting a US economic slowdown is coming, we are not yet seeing signs of an ease in inflationary pressures, an important distinction given the Fed will continue with its aggressive tightening approach until it sees evidence of the latter.”
Purchasing managers’ indices (PMIs) are economic indicators derived from monthly surveys of executives in private-sector companies. They are diffusion indices, which means a reading of 50% represents no change from the previous period, while a reading under 50% implies respondents reported a deterioration on average.
A reading “above 48.7%, over a period of time, generally indicates an expansion of the overall economy” according to the ISM.
The ISM’s manufacturing PMI figures appear to lead US GDP by several months despite a considerable error in any given month. The chart below shows US GDP on a “year on year” basis (and not the BEA annualised basis) against US GDP implied by monthly PMI figures.
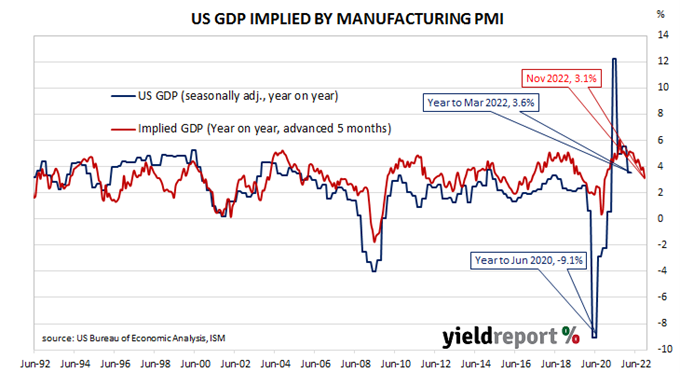
According to the ISM and its analysis of past relationships between the PMI and US GDP, June’s PMI corresponds to an annualised growth rate of 1.5%, or 0.4% over a quarter. Regression analysis on a year-on-year basis suggests a 12-month GDP growth rate of 3.1% five months after this latest report.
The ISM index is one of two monthly US PMIs, the other being an index published by IHS Markit. IHS Markit also produces a “flash” estimate in the last week of each month which comes out about a week before the ISM index is published. The IHS Markit June flash manufacturing PMI registered 52.4%, 4.6 percentage points lower than May’s final figure.