Summary: US industrial output up 0.4% in September, above market expectations; up 5.3% over past 12 months; goes against ISM data signal, not expected to persist; capacity utilisation rate up 0.2ppts to 80.3%, slightly above long-term average.
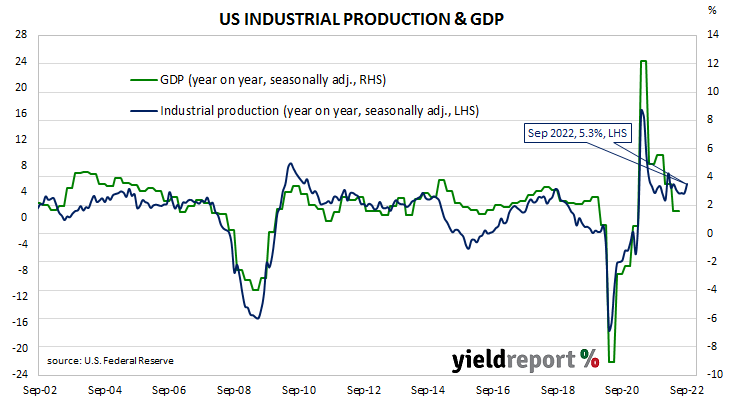
The Federal Reserve’s industrial production (IP) index measures real output from manufacturing, mining, electricity and gas company facilities located in the United States. These sectors are thought to be sensitive to consumer demand and so some leading indicators of GDP use industrial production figures as a component. US production collapsed through March and April of 2020 before recovering the ground lost over the fifteen months to July 2021.
According to the Federal Reserve, US industrial production expanded by 0.4% on a seasonally adjusted basis in September. The result contrasted with the 0.1% decline which had been generally expected as well as August’s 0.1% decrease after it was revised up from -0.2%. On an annual basis the growth rate accelerated from August’s revised figure of 3.9% to 5.3%.
“These results go against the signal in the ISM data, which has been on a softening trajectory for some months now,” said ANZ Head of FX Research Mahjabeen Zaman. “Part of the strength in manufacturing of late has been an auto production catch-up story, and therefore isn’t expected to persist.“
Long-term US Treasury bond yields moved higher on the day while short-term yields declined. By the close of business, the 10-year Treasury yield had added 2bps to 3.99% and the 30-year yield had gained 5bps to 4.01%. The 20-year yield finished 1bp lower at 4.44%.
In terms of US Fed policy, expectations of a steeper path for the federal funds rate over the next 12 months softened. At the close of business, November contracts implied an effective federal funds rate of 3.80%, 72bps higher than the current spot rate while December contracts implied 4.21%. November 2023 futures contracts implied an effective federal funds rate of 4.625%, about 145bps above the spot rate.
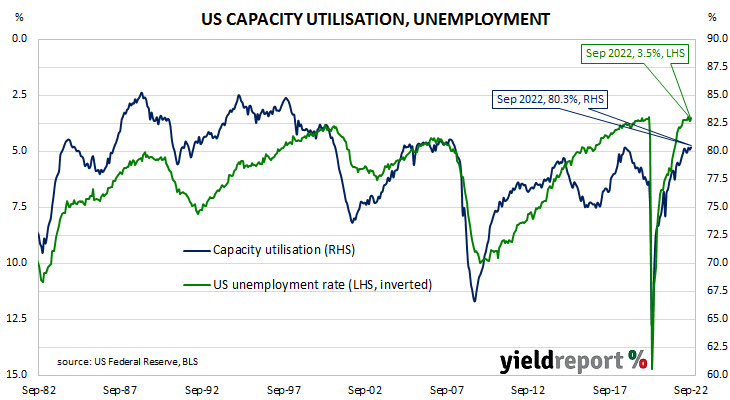
The same report includes US capacity utilisation figures which are generally accepted as an indicator of future investment expenditure and/or inflationary pressures. Capacity usage had hit a high for the last business cycle in early 2019 before it began a downtrend which ended with April 2020’s multi-decade low of 64.2%. September’s reading increased from August’s revised figure of 80.1% to 80.3%, slightly above the long-term average of 80.0%.
While the US utilisation rate’s correlation with the US jobless rate is solid, it is not as high as the comparable correlation in Australia.