
Summary: ISM PMI up in April, above expectations; ISM: reading reflects companies continuing to manage outputs to better match demand; US Treasury yields up considerably; expectations of Fed rate rise firms; NAB: does not allay concerns about the inflation outlook ; ISM: reading corresponds to 0.6% US GDP contraction annualised.
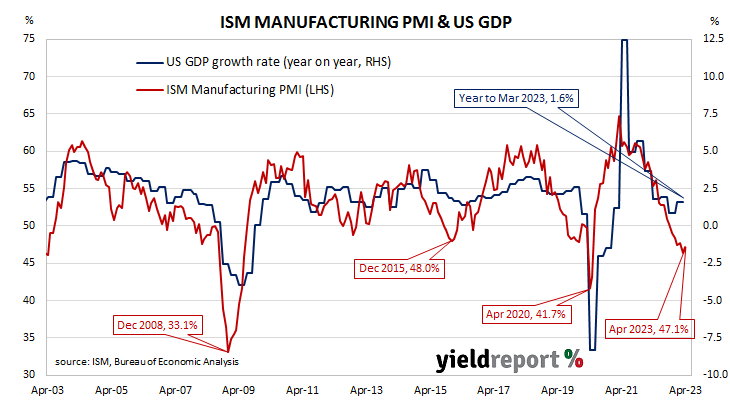
The Institute of Supply Management (ISM) manufacturing Purchasing Managers Index (PMI) reached a cyclical peak in September 2017. It then started a downtrend which ended in March 2020 with a contraction in US manufacturing which lasted until June 2020. Subsequent month’s readings implied growth had resumed, with the index becoming stronger through to March 2021. Readings then declined fairly steadily through to the first quarter of 2023.
According to the ISM’s April survey, its PMI recorded a reading of 47.1%, above the generally expected figure of 46.8% as well as March’s 46.3. The average reading since 1948 is 53.0% and any reading below 50% implies a contraction in the US manufacturing sector relative to the previous month.
“The April composite index reading reflects companies continuing to manage outputs to better match demand for the first half of 2023 and prepare for growth in the late summer/early fall period,” said Timothy Fiore, Chair of the ISM’s Manufacturing Business Survey Committee.
US Treasury yields finished the day considerably higher. By the close of business, the 2-year Treasury bond yield had gained 15bps to 4.15%, the 10-year yield had added 17bps to 3.59% while the 30-year yield finished 15bsp higher at 3.83%.
In terms of US Fed policy, expectations of a higher federal funds rate in the short-term firmed while expectations of rate cuts further out softened. At the close of business, contracts implied the effective federal funds rate would average 5.04% in May, 21bps higher than the current spot rate, and then move up to an average of 5.105% in June. July futures contracts implied a 5.13% average effective federal funds rate while May 2024 contracts implied 3.915%, 91bps less than the current rate.
“Manufacturing is a small share of the US economy but the combination of higher prices paid and the rebound in employment don’t allay concerns about the inflation outlook,” NAB economist Taylor Nugent said.
Purchasing managers’ indices (PMIs) are economic indicators derived from monthly surveys of executives in private-sector companies. They are diffusion indices, which means a reading of 50% represents no change from the previous period, while a reading under 50% implies respondents reported a deterioration on average. A reading “above 48.7%, over a period of time, generally indicates an expansion of the overall economy” according to the ISM.
The ISM’s manufacturing PMI figures appear to lead US GDP by several months despite a considerable error in any given month. The chart below shows US GDP on a “year on year” basis (and not the BEA annualised basis) against US GDP implied by monthly PMI figures.
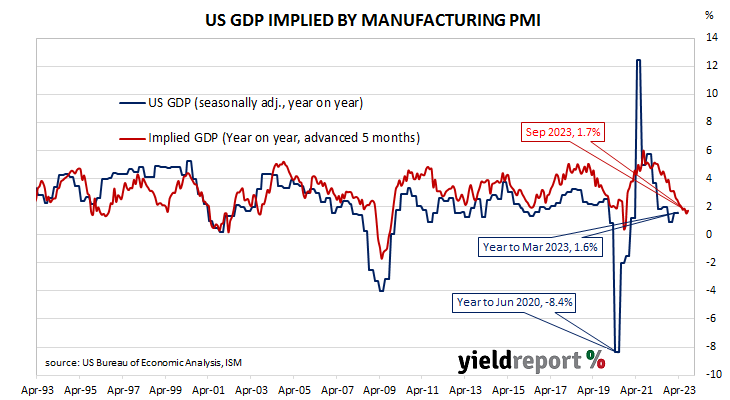
According to the ISM and its analysis of past relationships between the PMI and US GDP, April’s PMI corresponds to an annualised contraction rate of 0.6%, or 0.2% over a quarter. However, regression analysis on a year-on-year basis suggests a 12-month GDP growth rate of 1.6% five months after this latest report.
The ISM index is one of two monthly US PMIs, the other being an index published by S&P Global. S&P Global produces a “flash” estimate in the last week of each month which comes out about a week before the ISM index is published. The S&P Global flash April manufacturing PMI registered 50.4%, 1.2 percentage points higher than March’s final figure.