| Close | Previous Close | Change | |
|---|---|---|---|
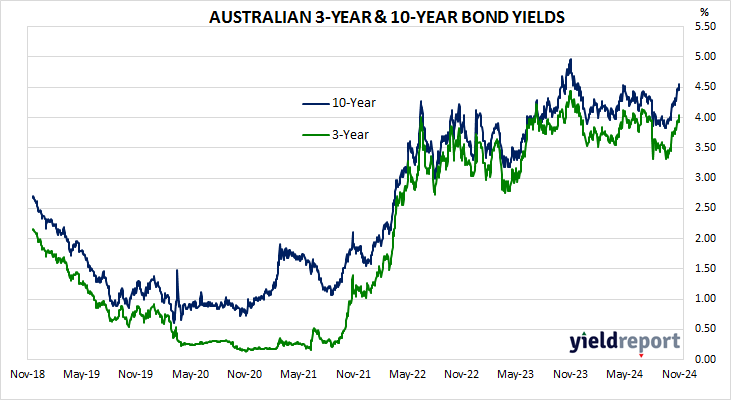
| Australia 3-year bond* (%) | 4.04 | 4.01 | 0.03 |
| Australia 10-year bond* (%) | 4.55 | 4.52 | 0.03 |
| Australia 20-year bond* (%) | 4.89 | 4.85 | 0.04 |
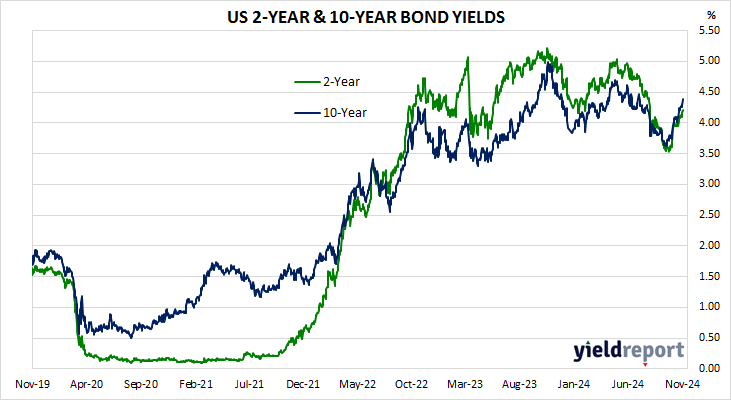
| United States 2-year bond (%) | 4.21 | 4.17 | 0.04 |
| United States 10-year bond (%) | 4.39 | 4.29 | 0.10 |
| United States 30-year bond (%) | 4.58 | 4.48 | 0.10 |
* Implied yields from December 2024 futures. As at 1 November.
LOCAL MARKETS
Australian Commonwealth Government bond yields rose moderately along the curve. Domestic economic reports of note included the September household spending indicator, the October CoreLogic home Value Index and September dwelling finance approval numbers.
The next RBA Board meeting ends on 5 November. November futures implied an average cash rate of 4.33% for the month, thus pricing in a low probability of a 25bp cut at the meeting. September 2025 futures implied 3.94%, 40bps below the current cash rate, thus inferring one 25bp cut and a solid probability of second cut between now and next September.
US MARKETS
US Treasury bond yields increased moderately at the front of the curve while longer-term yields rose more noticeably. Economic data of note included October non-farm payroll figures and the ISM’s October manufacturing PMI.
The next FOMC meeting ends on 7 November. November federal funds futures implied an average cash rate of 4.64% for the month and thus a very high probability of a 25bp rate cut at the meeting. September 2025 contracts implied 3.735%, 110bps less than the current federal funds effective rate.