
| Close | Previous Close | Change | |
|---|---|---|---|
| Australian 3-year bond (%) | 3.321 | 3.344 | -0.023 |
| Australian 10-year bond (%) | 4.232 | 4.261 | -0.029 |
| Australian 30-year bond (%) | 4.936 | 4.98 | -0.044 |
| United States 2-year bond (%) | 3.924 | 3.877 | 0.047 |
| United States 10-year bond (%) | 4.395 | 4.365 | 0.03 |
| United States 30-year bond (%) | 4.884 | 4.888 | -0.004 |
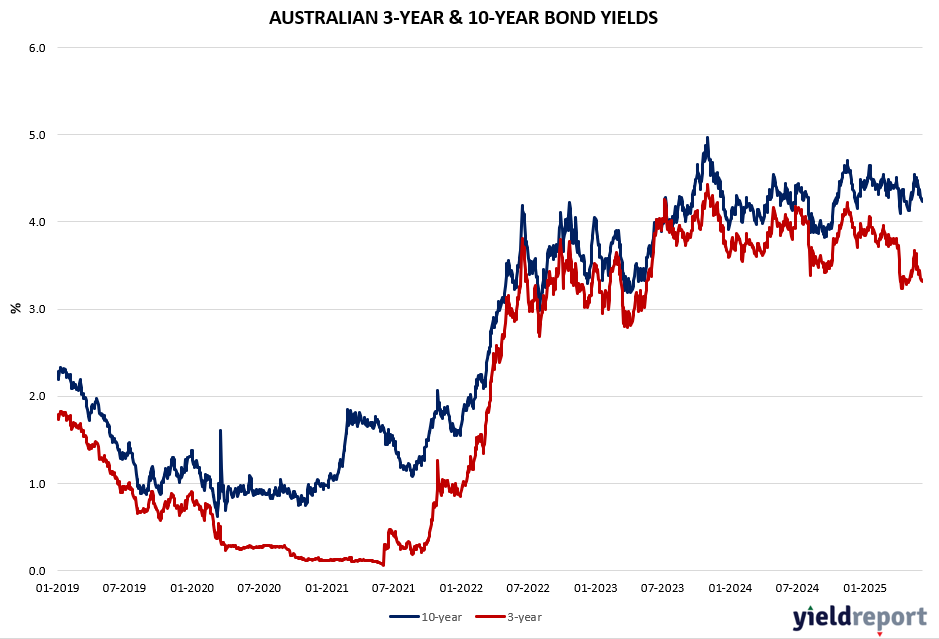
Overview of the Australian Bond Market
Australia’s 10-year government bond yield fell to around 4.27%, staying near its lowest level in over four weeks, weighed by a dovish Reserve Bank outlook. Q1 GDP growth came in below expectations, while PMI surveys indicated slowing expansion in the services and manufacturing sectors in May. The trade surplus also narrowed, reflecting a monthly decline in exports due to moderating overseas demand.
These weakening economic indicators support the case for further monetary easing by the central bank, especially given the latest RBA minutes, which emphasized that future policy decisions will remain data-dependent. Assistant Governor Sarah Hunter also recently cautioned that “higher US tariffs will slow down the global economy,” warning that increased uncertainty could reduce investment, output, and employment in Australia, further raising the prospects of looser monetary policy.
Overview of the US Bond Market
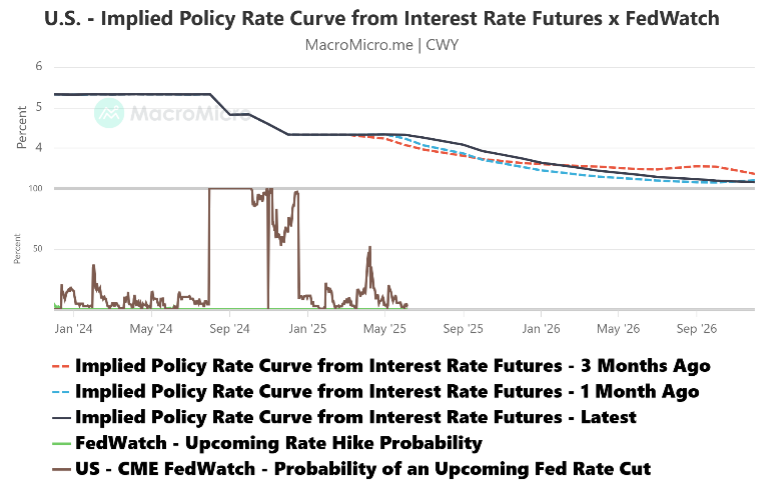
Treasuries slumped after stronger-than-expected US job and wage growth prompted traders to trim bets that the Federal Reserve will cut interest rates this year. The Friday selloff lifted yields across maturities by as much as 12 bps, led by shorter-dated tenors more sensitive to Fed rate changes. The benchmark 10-year note’s rate rose 12 bps to 4.51%, and yields across the spectrum once again exceeded 4%. Interest-rate swaps showed traders now see a roughly 70% chance of a quarter-point rate cut by September, compared with a probability of about 90% on Thursday. The amount of easing priced in for the year declined to about 43 bps, fewer than two quarter-point cuts.
US job growth moderated in May and the prior months were revised lower, indicating employers are cautious about growth prospects as they weigh the Trump administration’s economic policy. Nonfarm payrolls increased 139,000 last month after a combined 95,000 in downward revisions to the prior two months. The unemployment rate held at 4.2%, while wage growth accelerated. Employers have been ‘hoarding labour’ in the face of massive corrosive uncertainty. It costs money to fire workers, and we believe firms have been reluctant to lay off workers until they saw the extent of the Trump tariffs. Lessons were learnt during Covid.But dig deeper. Cracks in the façade of labour market resilience are now starting to show and the longer the tariff uncertainty and government spending cuts continue the worse the labour market reports are bound to be. The advance in payrolls reflected strength at service providers, including health care and social assistance as well as leisure and hospitality (see Figure 2). The latter is a seasonal market, so the read we’d say is not as solid as it may have appeared at a headline level. On that front, industries that are more exposed to tariffs flashed warning signs. Manufacturing payrolls dropped 8,000 last month, the most this year, while employment growth in transportation and warehousing rose slightly after declining in each of the prior two months. Employment at temporary-help agencies fell by the most since October.
Furthermore, the household survey, showed a 254,000 increase in the number of people who went from employed to out of work during the month. That was the biggest rise since the start of 2022. Another major question for economists and policymakers is the extent to which Trump’s efforts to cut back on government spending will take a toll on employment. The federal government shed 22,000 jobs in May, the most since 2020. Economists contend that at least half a million US jobs could be on the line as federal spending cuts spread to contractors, universities and others who rely on public funding. Cracks in employment and wage growth – the Fed remains very much ‘wait and see’. Forget about Trump’s exhortation for a 100 bps cut – they are not even thinking 25 bps currently. And indeed that is what the markets are reflecting.
-
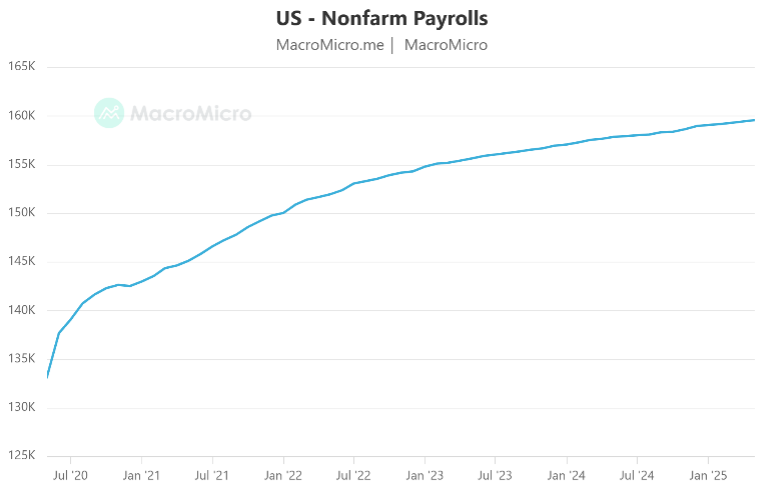
- Figure 1: US Nonfarm Payrolls (of May 2025)

-
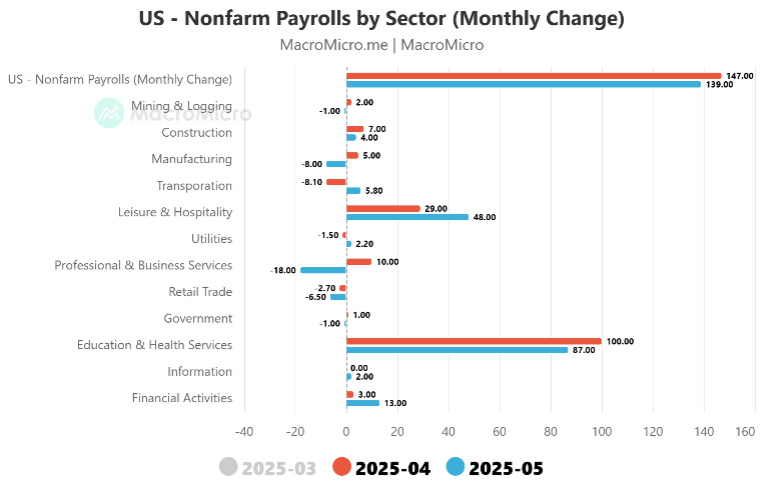
- Figure 2: US Nonfarm Payrolls by Sector (May ’25)

Regarding figure 4, the CME FedWatch Tool forecasts the probability of a rate hike (or rate cut) at upcoming FOMC meetings, allowing market participants to gauge the likelihood of changes in interest rates and the direction of the Fed’s monetary policy. You can see why the 2-year bond jumped 12 bps on Friday.
-
- Figure 3: Swaps Market Pricing of Fed Cuts

-
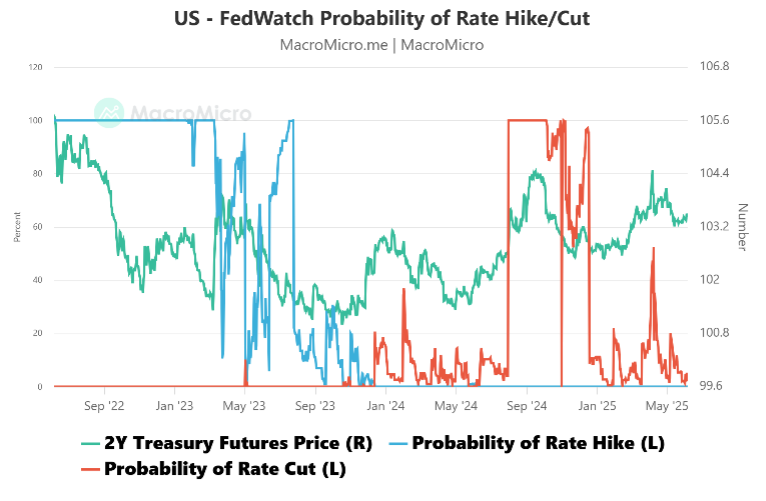
- Figure 4: Probability of a Rate Hike / Cut
