Summary:
The ratings spectrum stack has been inverted recently. And it has nothing to do with fundamentals, rather technicals. Ultimately, the market will come back to fundamentals, so now may be a good opportunity to take advantage. Lets look at the inversion moves by order of ratings stack priority.
So in the prior week, 10-year U.S. Treasury yields rose 50 bps to 4.49%, the largest single-week increase since 2001. U.S. Treasury yields moved sharply higher, with 10-year yields rising 50 basis points (bps) to 4.49%. This was the largest single-week increase since 2001. 2-year yields rose by a more modest 31 bps. Trade policy uncertainty persisted, though there were early signs of a walk back in tariffs. President Trump announced a 90-day pause for most new tariffs, except those on China. After markets closed on Friday, the White House announced exemptions for Chinese imports of electronics. Despite strong demand at 10- and 30-year auctions, there are fresh concerns about foreign demand for dollar-denominated assets. The dollar weakened broadly, with losses concentrated against assets perceived as reserve asset alternatives. Gold, the Swiss franc and the euro advanced 6.6%, 5.6% and 3.7%, respectively, against the dollar.
Investment grade corporates weakened sharply, returning -2.82%, the asset class’s worst weekly performance in more than three years. Most of the weakness was driven by the broad increase in interest rates, with spreads on investment grade corporates widening 4 bps. That trend led to underperformance of -2 bps versus similar-duration Treasuries. Nevertheless, the asset class experienced substantial outflows totaling almost -$10 billion. That was the fourth-largest weekly outflow on record and the largest since March 2020. Amid the volatility, supply was light, with less than $9 billion pricing. Supported by the low volume, demand was very healthy with oversubscription rates of 6x and new issue concessions of 5-10bps.
High yield corporates also weakened, returning -0.70%. That was better performance than many other spread asset classes, thanks to the twin supports of shorter duration and an 8 bps tightening in spreads. As a result, the asset class outperformed similar-duration Treasuries by 38 bps. Senior loans returned 0.01%. Despite the relatively strong performance, both asset classes saw outflows totaling -$9.6 billion and -$6.5 billion in high yield and loans, respectively. Neither asset class had any new issuance.
Emerging markets also retreated, returning -2.45% but lagging similar-duration Treasuries by -4 bps. The weakness was concentrated in high yield names, which saw spreads widen by 30 bps, versus 2 bps of tightening in investment grade. The asset class had its biggest weekly outflow in almost three years at almost -$5 billion. As in leveraged finance markets, there was no new issuance in emerging markets.
Exhibit 1: Australian 3Y/10Y Bond Yield
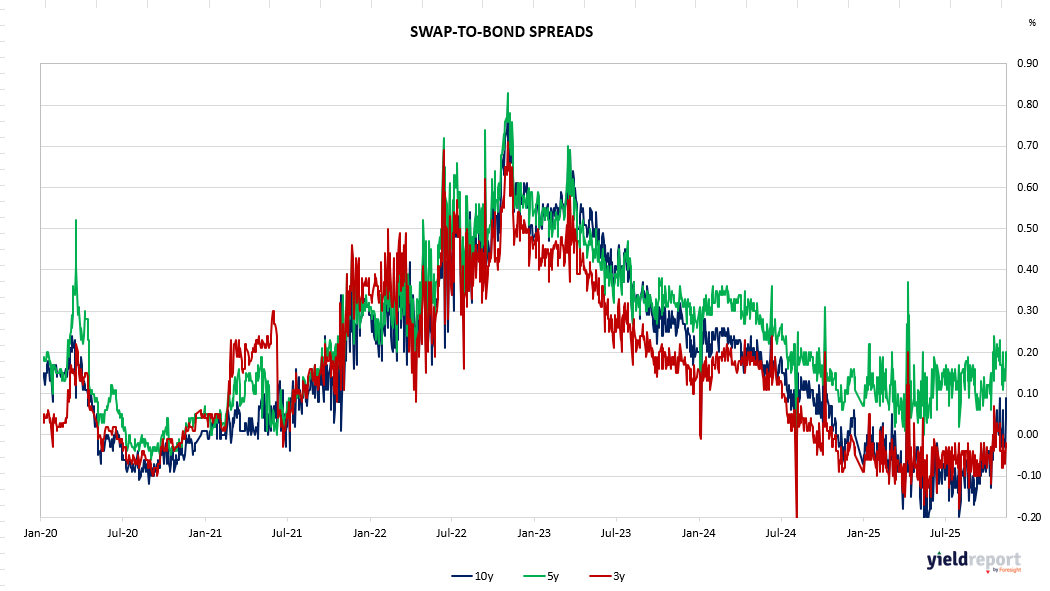
Exhibit 2: AU and US Bond Yields Spread |
Bank Bill Swap Rates
TERM TO MATURITY | CLOSING RATE | Δ WEEK | Δ MONTH |
---|---|---|---|
1 month | 4.0699 | -0.0402 | -0.0187 |
3 months | 4.003 | -0.1161 | -0.1107 |
6 months | 4.0525 | -0.169 | -0.1773 |
SWAP RATES
TERM TO MATURITY | CLOSING RATE | Δ WEEK | Δ MONTH |
---|---|---|---|
1 year | 3.411 | -0.0294 | -0.399 |
3 years | 3.2813 | -0.1297 | -0.4237 |
5 years | 3.6888 | -0.2035 | -0.3242 |
10 years | 4.1758 | -0.2177 | -0.1652 |
15 years | 4.3958 | -0.2352 | -0.1222 |