| Close | Previous Close | Change | |
|---|---|---|---|
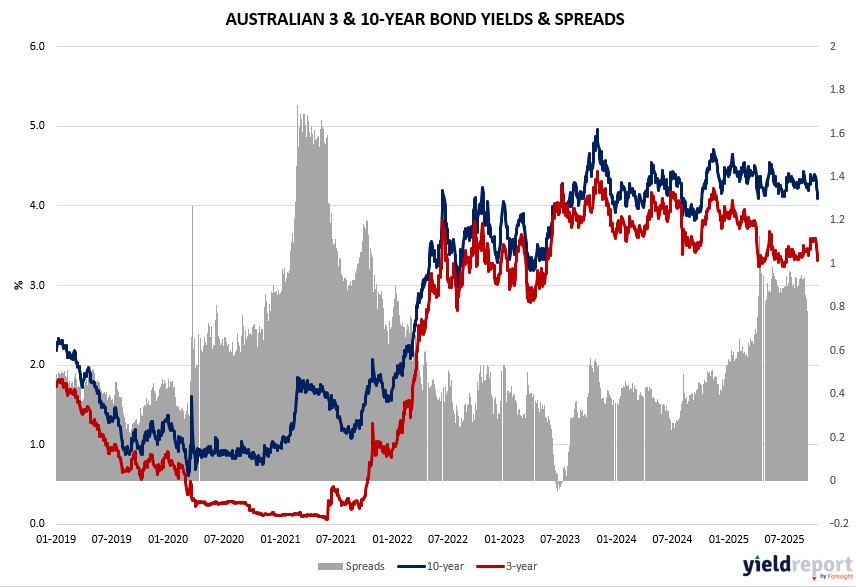
| Australian 3-year bond (%) | 3.35 | 3.348 | 0.002 |
| Australian 10-year bond (%) | 4.112 | 4.126 | -0.014 |
| Australian 30-year bond (%) | 4.795 | 4.824 | -0.029 |
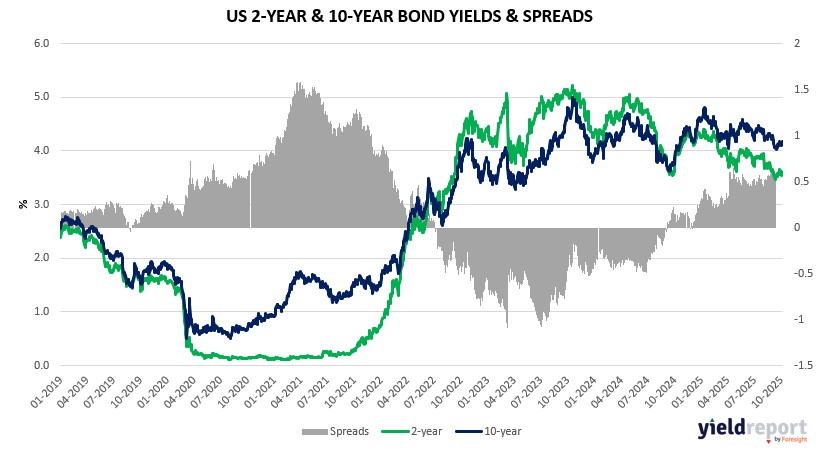
| United States 2-year bond (%) | 3.455 | 3.459 | -0.004 |
| United States 10-year bond (%) | 3.957 | 3.976 | -0.019 |
| United States 30-year bond (%) | 4.5391 | 4.5664 | -0.0273 |
Overview of the Australian Bond Market
Australian government bond yields were mixed on October 22, 2025, with the 10-year down 2 basis points to 4.10% amid global haven flows from equity and gold volatility, though the 2-year rose 1 basis point to 3.32% reflecting caution on local data. Longer ends like the 15-year eased 2 basis points to 4.43%, tracking US yield dips as oil’s spike highlighted supply-demand imbalances potentially capping inflation.
Macro blends encompassed gold’s retreat from debasement-driven highs, with DWS’s Darwei Kung viewing pullbacks as sensible near $4,400 without altering bullish outlooks, while shutdown-induced data gaps amplify labor fragility per Goldman, blending into yield pressures if PMIs signal slowdowns. Positioning may test October 23 manufacturing PMI after 51.4 prior, and services at 52.4, potentially easing yields if softness emerges amid US-China negotiations and Trump’s tariff reshaping.
With AUD/USD in a 0.6440-0.6535 range per Reuters, holding patterns await October 24 US CPI polling 0.3% core monthly—sticky at 3.1% annually—where lower oil forecasts aid disinflation, supporting bonds if consumer stress persists per NAB. Dealers expect steady auctions, as RBA monitors for dovish Fed spillovers.
Overview of the US Bond Market
Treasury yields dipped modestly on October 22, 2025, with the 10-year down 1 basis point to 3.95%, as a strong $13 billion 20-year auction drew demand amid equity volatility and gold’s extended pullback, though subdued dollar trading—the quietest in over a decade—limited moves amid the government shutdown and global tensions. Shorter maturities like the 2-year eased 1 basis point to 3.44%, reflecting bets on Fed easing despite sticky inflation, with macro factors like oil’s 3.4% jump to $59.20 potentially pressuring yields if supply gluts persist.
Blended influences included the shutdown’s data vacuum, where ADP halted private payroll feeds post-Fed speeches, heightening focus on labor fragility as Goldman Sachs pegs trend payrolls at 25,000 monthly—well below breakeven—amid AI adoption and tariff uncertainties. Positioning showed asset managers trimming net long Treasury futures per delayed CFTC data, with cuts in 5- and 30-year contracts, while leveraged funds pared shorts; JPMorgan’s survey indicated shrinking longs ahead of key releases. Dealers anticipate steady coupon sizes for November-January, aligning with guidance, as Macquarie’s Thierry Wizman highlights Fed dovishness and US-China reconciliation as risk tailwinds.
Upcoming October 23 existing home sales could underscore housing softness if below poll, while October 24 core CPI—expected at 0.3% monthly, 3.1% annually—may test the market’s shrug-off of inflation above 3% for nearly five years, per Reuters analysis, potentially reinforcing downward yield pressure if labor concerns dominate. With oil gluts forecasting $55 Brent by year-end per Eurasia Group, aiding consumer power, bonds may find support if data signals slowdowns, though resilient earnings could cap declines.