| Close | Previous Close | Change | |
|---|---|---|---|
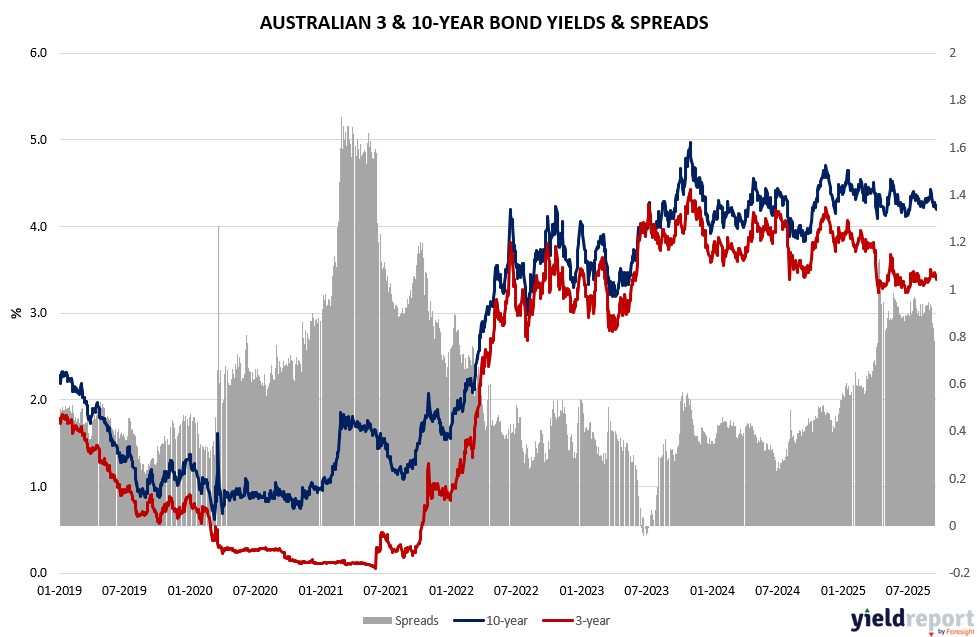
| Australian 3-year bond (%) | 3.436 | 3.384 | 0.052 |
| Australian 10-year bond (%) | 4.248 | 4.192 | 0.056 |
| Australian 30-year bond (%) | 4.992 | 4.902 | 0.09 |
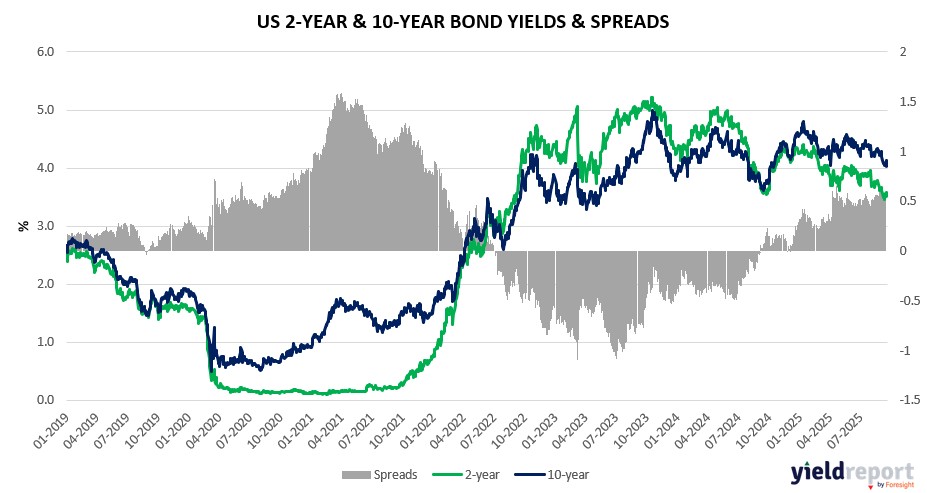
| United States 2-year bond (%) | 3.576 | 3.528 | 0.048 |
| United States 10-year bond (%) | 4.129 | 4.055 | 0.074 |
| United States 30-year bond (%) | 4.7507 | 4.6563 | 0.0944 |
Overview of the Australian Bond Market
US Treasuries dipped further on September 19, 2025, as yields climbed amid economic resilience and tariff jitters, capping a week of post-cut reassessment with volatility near one-year lows despite geopolitical flares. The 2-year yield rose to 3.57% up 2 basis points weekly, the 5-year to 3.68% up 13 basis points from prior, the 10-year to 4.13% up 16 basis points, and the 30-year to 4.74% up 15 basis points. Gains erased amid robust prints like Philly Fed’s 23.2 surge—beating 2.5 estimates—and prior jobless claims drop, signaling no rush for aggressive easing beyond the 4%-4.25% range.
Integrating macro insights, FedEx’s $1 billion tariff warning highlights trade war drags on earnings, mirroring August’s 0% import prices YY and resilient 0.6% retail sales MM, per Wolfe’s Stephanie Roth on dual-mandate tensions. Housing starts’ prior 1.307 million miss lingers, but BI’s model flags middling growth—0.5 reading—yielding tepid 4% S&P returns, versus recessionary 13%. JPMorgan surveys showed pre-Fed longs at lows, with asset managers trimming $23.5 million per basis point in 5- and 10-year futures, CFTC data indicating leveraged shorts pared by $5-6.5 million; swaps eye under 50 basis points year-end cuts. BofA surveys elevate geopolitics—Russia drones, Gaza assault, Trump policies—yet markets shrug unless oil spikes or bonds tumble, as BlackRock’s Jewell quantifies via consumer/currency earnings hits. Auction sizes unchanged through Q4 per Treasury, amid EU/Japan deals curbing uncertainty for higher rates longer under Trump-Powell dynamics.
Overview of the US Bond Market
Australian government bond yields ticked higher on September 19, 2025, extending gains amid global firming post-Fed and domestic labor softness, as traders reassess RBA cut odds with unemployment steady but jobs missing forecasts. The 2-year yield rose to 3.36% up 4 basis points weekly, the 5-year to 3.65% up 5 basis points, the 10-year to 4.24% up 5 basis points, and the 15-year to 4.61% up 7 basis points. The climb reflected offshore Treasury pressure and tempered easing expectations, as August’s 5.4 thousand job contraction—against 21.5 thousand adds—kept the 4.2% rate but signaled demand cooling, prompting eToro warnings of inadequate RBA response post its 3.60% stance.
Blending macro views, tariff uncertainties echo US FedEx warnings of $1 billion hits, potentially inflating imports per prior 0% August YY rise, complicating RBA’s mandate amid resilient yet middling growth per Bloomberg Intelligence models. The AUD’s 0.34% dips to 0.659 underscores greenback rebound, though gold’s $3,686 close bolsters miners. Dealers hold auction sizes steady per April, with Bessent’s 90-day China truce option possibly easing pass-through, as EU/Japan pacts dissipate volatility.