| Close | Previous Close | Change | |
|---|---|---|---|
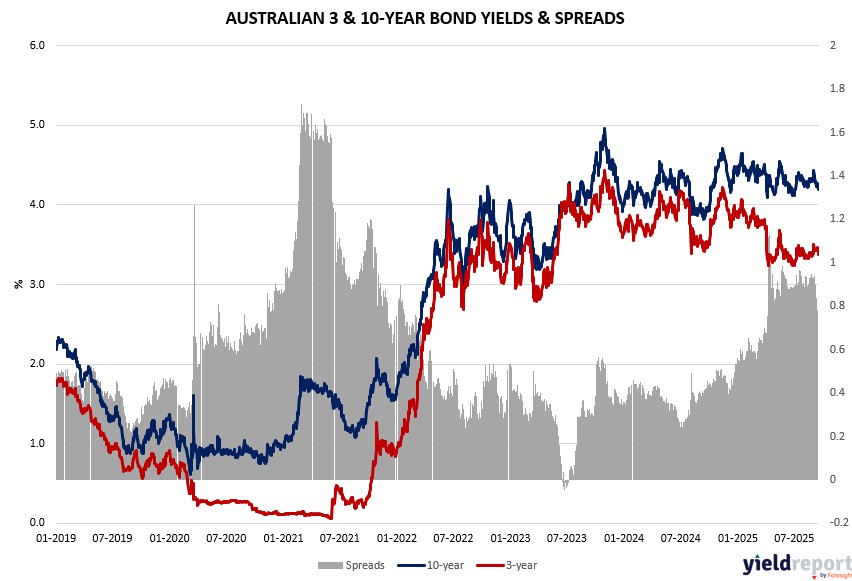
| Australian 3-year bond (%) | 3.384 | 3.427 | -0.043 |
| Australian 10-year bond (%) | 4.192 | 4.226 | -0.034 |
| Australian 30-year bond (%) | 4.902 | 4.943 | -0.041 |
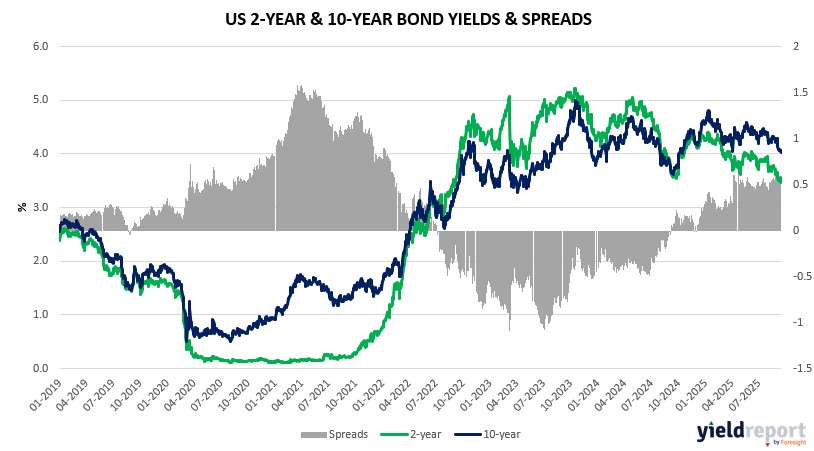
| United States 2-year bond (%) | 3.528 | 3.516 | 0.012 |
| United States 10-year bond (%) | 4.055 | 4.022 | 0.033 |
| United States 30-year bond (%) | 4.6563 | 4.6256 | 0.0307 |
Overview of the Australian Bond Market
Australian government bond yields edged higher on September 18, 2025, as the labor market’s unexpected contraction tempered easing bets and global yields firmed post-Fed, pressuring prices ahead of weekend positioning. The 2-year yield held at 3.36%, the 5-year rose 1 basis point to 3.65%, the 10-year climbed 2 basis points to 4.24%, and the 15-year advanced 3 basis points to 4.60%. The uptick blended domestic weakness with offshore momentum, as August’s 5.4 thousand job loss—far below 21.5 thousand expected—kept unemployment at 4.2% but highlighted softening demand, per eToro’s Farhan Badami, potentially forcing RBA reconsideration of its 3.60% stance despite steadying the dial on aggressive cuts.
Macro crosscurrents underscore tariff vigilance mirroring US concerns, with China’s equity rebound and iron ore stability bolstering Australia’s export outlook, though Santos’ failed $28 billion deal spotlights acquisition hurdles in energy. The AUD’s 0.50% drop to 0.6619 amplified yield appeal, as Pepperstone analysts tie currency resilience to policy stability versus global peers. Dealers maintain steady auction sizes per April guidance, with Treasury Secretary Bessent’s floated 90-day China tariff truce extension potentially curbing import inflation pass-throughs, easing RBA’s dual mandate strains.
Overview of the US Bond Market
US Treasuries pulled back on September 18, 2025, erasing post-Fed gains as robust labor data eased deep-cut fears, lifting yields in a reassessment of policy pace amid record equity highs. The 2-year yield rose 2 basis points to 3.56%, the 5-year to 3.66%, the 10-year advanced 3 basis points to 4.10%, and the 30-year climbed 4 basis points to 4.72%. Shorter-end pressure mounted after jobless claims plunged to 231 thousand, the largest drop in nearly four years and under 240 thousand estimates, while Philly Fed’s 23.2 surge—versus 2.5 forecasts—affirmed hiring stability, signaling the Fed’s 25 basis-point trim to 4%-4.25% as insurance rather than panic.
Weaving in macro threads, the print aligns with Powell’s labor focus, where low firing/low hiring reflects structural immigration drags over cyclical woes, per prior remarks, bolstering non-recessionary narratives that historically yield 15% S&P returns a year post-cuts near highs, via JPMorgan data. Housing starts’ prior miss lingers, but resilient consumer outlays from retail sales beats support higher-for-longer views, as Wolfe Research’s Stephanie Roth notes trade-offs with tariff-stoked goods inflation. JPMorgan surveys pre-Fed showed net longs at two-month lows, with asset managers cutting $23.5 million per basis point in 5- and 10-year futures, while CFTC data reflected leveraged funds trimming shorts by $5-6.5 million; swap contracts now eye under 50 basis points year-end easing. Auction schedules hold unchanged through Q4 per Treasury, as EU/Japan deals dissipate uncertainty, reinforcing elevated rates amid Trump’s influence on Powell.