| Close | Previous Close | Change | |
|---|---|---|---|
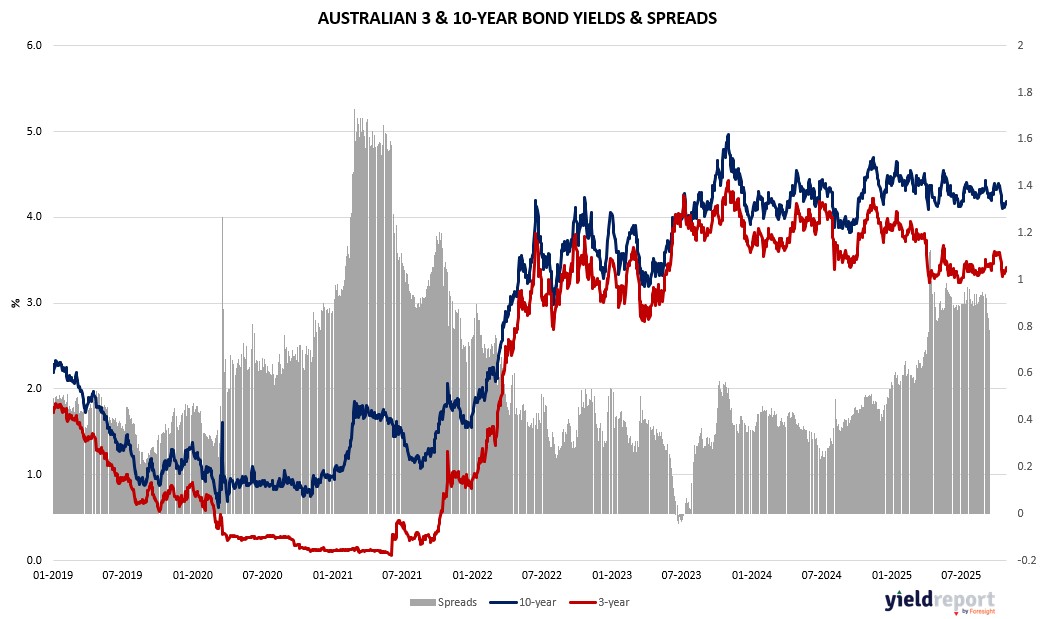
| Australian 3-year bond (%) | 3.416 | 3.371 | 0.045 |
| Australian 10-year bond (%) | 4.189 | 4.144 | 0.045 |
| Australian 30-year bond (%) | 4.882 | 4.832 | 0.05 |
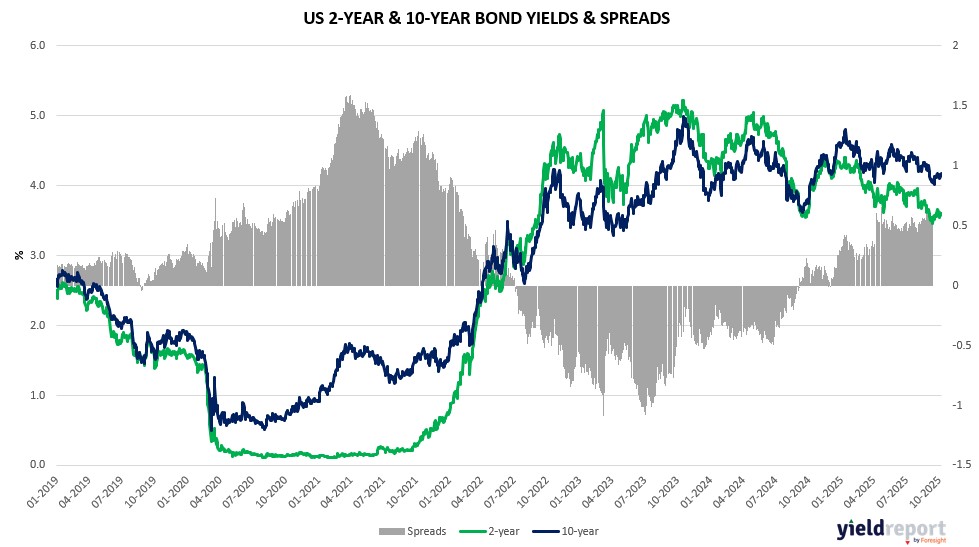
| United States 2-year bond (%) | 3.503 | 3.497 | 0.006 |
| United States 10-year bond (%) | 4.028 | 4.01 | 0.018 |
| United States 30-year bond (%) | 4.6157 | 4.5938 | 0.0219 |
Overview of the Australian Bond Market
Australian government bond yields rose modestly on October 27, 2025, with the 10-year up 3 basis points to 4.17%, tracking mixed US moves amid trade optimism, though AUD/USD up 0.3% at 0.6535 capped upside from RBA’s Bullock on inflation. Shorter 2-year climbed 7 basis points to 3.41%, reflecting CPI caution, while 15-year added 2 basis points to 4.49% as risk-on weighed.
Macro blends encompassed October manufacturing PMI contraction at 49.7 offset by services at 53.1, keeping composite expansion, signaling uneven growth per S&P amid tariff thaw ignoring security issues per CSIS’s Scott Kennedy. Positioning sensitive to Q3 CPI poll at 0.8% trimmed quarterly—potentially dovish if softer—where Westpac notes regulated price hikes like electricity up 11%, heightening shutdown-like data reliance. Dealers expect steady auctions, as RBA eyes Fed’s October 29 cut.
Upcoming October 28 consumer confidence, October 29 CPI at 3% headline yearly, and US GDP at 3% could affirm resilience, supporting bonds if jobs cool per NAB stress return.
Overview of the US Bond Market
Treasury yields dipped on October 27, 2025, with the 10-year down 2 basis points to 3.98%, as trade deal hopes boosted risk assets, though resilient PMIs and earnings tempered aggressive cuts. Shorter 2-year eased to 3.49%, reflecting dovish bets, with 30-year down to 4.55% amid gold’s slide signaling easing tensions.
Macro blends included University of Michigan sentiment at 53.6—five-month low on price erosion—yet S&P PMIs pickup and home sales at 4.06 million underscore jobs focus over sticky inflation, per Morgan Stanley’s Ellen Zentner seeing no surge amid shutdown gaps heightening private data reliance. Positioning per delayed CFTC likely trimmed longs, with JPMorgan’s Michael Feroli expecting QT end October 29 alongside cut, viewing benign trends as risk-management aid. Dealers anticipate steady auctions November-January, as BMO’s Ian Lyngen notes trade thaw ignoring security fights, with Trump’s positivity potentially averting escalation.
Upcoming October 28 consumer confidence at 93.2 poll could highlight finance worries, while October 29 Fed decision—3.875% target—eyes dovish tone per TD’s Oscar Munoz, with swaps at 120 basis points easing to sub-3% by mid-2026. Pacific’s Tiffany Wilding flagged anchored expectations despite tariffs, supporting bonds if labor cools.