
Australian ETF News
Schroders expands active ETF suite. Schroders Australia has launched a new active ETF, bringing a listed version of its Global Core active strategy to market. Schroders listed the Schroder Global Core Fund – Active ETF (ASX: CORE) today, marking its fifth active ETF. The launch is a celebration of its Global Core active strategy celebrating 25 years in market. CORE is an actively managed, quantitative global equity strategy and is priced at 0.25% per annum with no performance fees. The portfolio typically holds about 400 global companies, derived from a universe of over 15,000. The underlying strategy has outperformed its benchmark in 20 of its 25 years.
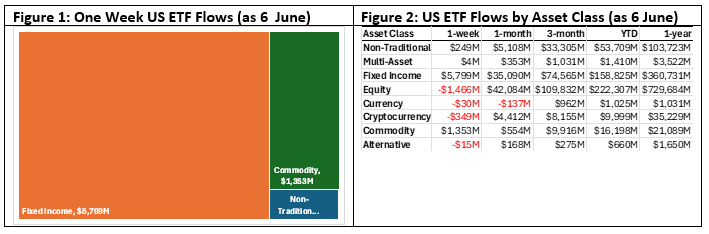
US ETF Flows by Asset Class
The value of ETF flows data is relatively obvious – it highlights asset class inflows and outflows. As such, it illustrates investor asset class preferences at any given time. Relative to the ASX data, which is monthly, US data is available on both a more frequent and timely basis. The data below is as at 6 June 2025.
Global Select ETF Launches
New issue ETFs reflect ‘real-time’ investment theme investor sentiment. i.e, what’s ‘hot’. Additionally, the largest Australian ETF issues are all part of large international entities. And often what ETF is issued in their home markets and, to some degree, subsequently issued in Australia.
Regarding the table below, there are several distinct themes reflecting investor preferences currently:
- Fixed Income – Go Active, Not Passive – The release of the JPMAM fixed income ETF is reflective of how fixed income should be done – active management not passive. By 2030, JPMAM forecasts that the global fixed income ETF market will grow to USD6 trillion (33% growth from 2024 year-end), with active fixed income ETFs expected to be a key driver for the overall ETF industry.
- European Defense ETFs – this sector has been a tear this year and which includes a host of ETF launches. Such ETFs provide an opportunity to tap into the growing European defense sector, which is expected to benefit from increased government spending on defense and security.
- The Invesco Global Enhanced Equity UCITS ETF is a factor based strategy, a strategy that we believe Australian investors do not pay enough attention to. For example, in the US 1Q25, outperformance was all largely factor-based.
| Figure 3: Select ETF Launches, for May 22nd to 28th 2025 |
|---|
| Select European ETF Launches |
| J.P. Morgan Asset Management launches Global IG Corporate Bond Active UCITS ETF |
| BNP Paribas Asset Management launches Europe defence ETF |
| Global X ETFs Europe launches Global X Europe Focused Defence Tech UCITS ETF |
| Invesco launches ETF with systematic active approach for outperforming global equities |
| Select US ETF Launches |
| Tidal ETFs launched the Alpha Brands Consumption Leaders ETF |
| Simplify Asset Management launched the Simplify Kayne Anderson Energy and Infrastructure Credit ETF |