
Summary: 10-year bond yield down in Australia; ACGB 10-year spread to US Treasury yield falls to -4bps; 10-year bond yields up in US, major European markets; $2.85 billion of bonds, notes issued by AOFM.
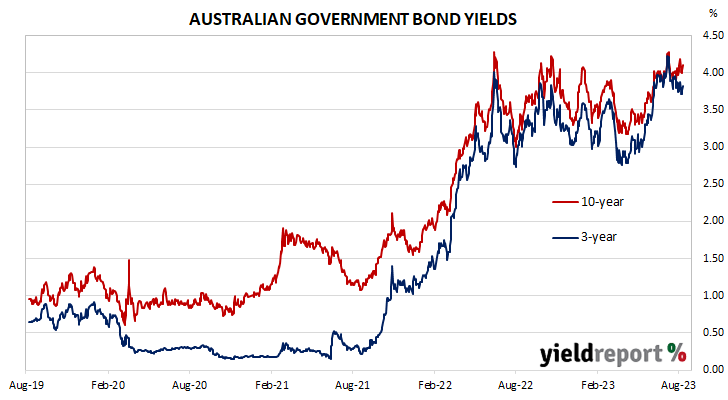
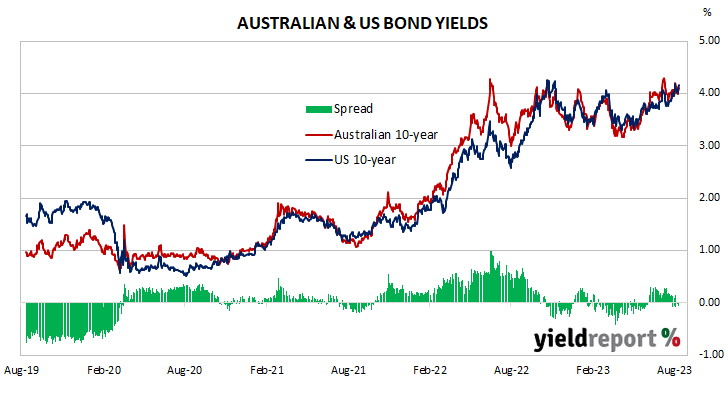
Locally, long-term ACGB yields fell away over the first two days of the week before rising noticeably through the remaining days of the week. By the end of it, the 3-year ACGB yield had lost 5bps to 3.82%, the 10-year yield had shed 8bps to 4.11% while the 20-year yield finished 7bps lower at 4.43%. The spread between US and Australian 10-year Treasury bond yields decreased from 15bps to -4bps.
Over in the US, 10-year bond yields started the week with a moderate rise rose which was reversed over the next two days. Yields rose substantially over the final two days of the week.
The Atlanta Fed’s Nowcast model was updated on Tuesday. Its September quarter GDP growth estimate was raised to 4.1% annualised, or a 1.0% expansion over the quarter.
July’s CPI report was released on Thursday and it produced a 0.2% increase, in line with expectations. The annual inflation rate increased from 3.1% to 3.3% while the core inflation rate slowed to 4.7%.
At the end of the week, the University of Michigan’s Consumer sentiment index declined slightly in August after posting a large rise in July.
July producer price indices (PPI) were released the same day. The index increased by 0.3% over the month, more than expected, and the annual growth rate accelerated to 0.8%.
By this point, US 2-year and 10-year Treasury bond yields had both gained 11bps to 4.89% and 4.15% while the 30-year yield finished 6bps higher at 4.26%.
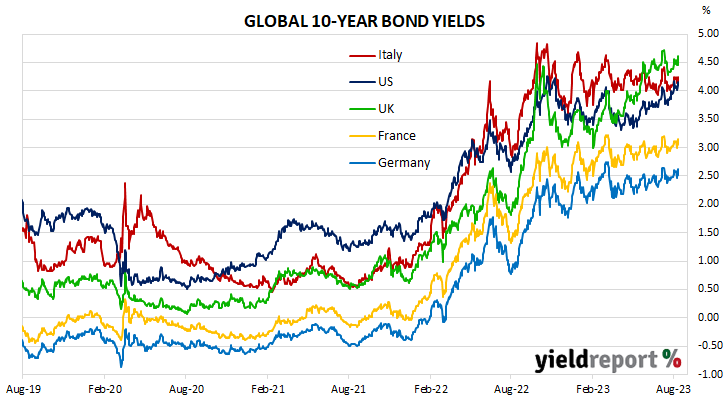
In major euro-zone markets, 10-year bond yields moved higher through most of the week with the exception of Tuesday when yields fell noticeably.
By the end of the week, German and French 10-year yields had both added 6bps to 2.62% and 3.15% respectively. The Italian 10-year BTP yield increased by 4bps over the week to 4.25% while the British 10-year gilt yield finished 15bps higher at 4.62%.
The AOFM held one vanilla bond tender and two index-linked bond (ILB) tenders this week; $700 million of June 2035s were priced at a yield of 4.03% while $100 million of September 2030 ILBs and $50 million of August 2040 ILBs were priced at real yields of 1.42% and 1.81% respectively. There were also two Treasury note tenders which raised $2.0 billion on a short-term basis.
The gross value of all bonds issued by the AOFM in the 2023/2024 financial year (not taking into account buy-backs or short-term Treasury note tenders) is $4.60 billion. There are currently $828.15 billion of Treasury bonds and $39.736 billion of Treasury index-linked bonds on issue. The next series to mature does so on 21 April 2024 when $35.90 billion worth of bonds are due. There are also $28.00 billion of short-term Treasury notes outstanding after $3 billion matured on Friday.
AUSTRALIAN GOVERNMENT BONDS
| MATURITY | COUPON (%) | ISSUE SIZE ($M) | CLOSING YIELD | Δ WEEK | Δ MONTH | WEEK HIGH | WEEK LOW |
|---|---|---|---|---|---|---|---|
| 21-Apr-24 | 2.75 | 35,900 | 4.09 | 0.00 | -0.36 | 4.09 | 4.02 |
| 21-Nov-24 | 0.25 | 41,300 | 4.04 | -0.04 | -0.41 | 4.09 | 3.97 |
| 21-Apr-25 | 3.25 | 41,500 | 3.93 | -0.05 | -0.47 | 3.99 | 3.84 |
| 21-Nov-25 | 0.25 | 39,200 | 3.87 | -0.05 | -0.44 | 3.92 | 3.78 |
| 21-Apr-26 | 4.25 | 39,600 | 3.84 | -0.05 | -0.41 | 3.89 | 3.74 |
| 21-Sep-26 | 0.50 | 37,800 | 3.82 | -0.05 | -0.41 | 3.87 | 3.72 |
| 21-Apr-27 | 4.75 | 36,700 | 3.82 | -0.05 | -0.39 | 3.87 | 3.72 |
| 21-Nov-27 | 2.75 | 31,400 | 3.82 | -0.05 | -0.37 | 3.87 | 3.72 |
| 21-May-28 | 2.25 | 30,900 | 3.84 | -0.06 | -0.35 | 3.89 | 3.73 |
| 21-Nov-28 | 2.75 | 34,100 | 3.86 | -0.06 | -0.33 | 3.92 | 3.75 |
| 21-Apr-29 | 3.25 | 36,600 | 3.89 | -0.06 | -0.31 | 3.96 | 3.79 |
| 21-Nov-29 | 2.75 | 34,700 | 3.93 | -0.07 | -0.28 | 4.00 | 3.82 |
| 21-May-30 | 2.50 | 37,100 | 3.97 | -0.07 | -0.26 | 4.04 | 3.86 |
| 21-Dec-30 | 1.00 | 38,700 | 4.01 | -0.07 | -0.22 | 4.08 | 3.90 |
| 21-Jun-31 | 1.50 | 38,100 | 4.03 | -0.08 | -0.21 | 4.11 | 3.92 |
| 21-Nov-31 | 1.00 | 21,000 | 4.06 | -0.08 | -0.19 | 4.14 | 3.94 |
| 21-May-32 | 1.25 | 39,300 | 4.08 | -0.08 | -0.18 | 4.16 | 3.96 |
| 21-Nov-32 | 1.75 | 29,000 | 4.09 | -0.09 | -0.16 | 4.18 | 3.98 |
| 21-Apr-33 | 4.50 | 25,100 | 4.09 | -0.09 | -0.16 | 4.18 | 3.98 |
| 21-Nov-33 | 3.00 | 21,800 | 4.11 | -0.09 | -0.15 | 4.19 | 4.00 |
| 21-May-34 | 3.75 | 18,800 | 4.12 | -0.09 | -0.14 | 4.21 | 4.01 |
| 21-Dec-34 | 3.50 | 16,300 | 4.14 | -0.09 | -0.14 | 4.23 | 4.03 |
| 21-Jun-35 | 2.75 | 12,250 | 4.17 | -0.09 | -0.13 | 4.26 | 4.06 |
| 21-Apr-37 | 3.75 | 12,300 | 4.26 | -0.09 | -0.11 | 4.34 | 4.15 |
| 21-Jun-39 | 3.25 | 10,300 | 4.35 | -0.08 | -0.08 | 4.43 | 4.25 |
| 21-May-41 | 2.75 | 13,800 | 4.41 | -0.08 | -0.04 | 4.49 | 4.32 |
| 21-Mar-47 | 3.00 | 14,200 | 4.47 | -0.09 | -0.01 | 4.56 | 4.38 |
| 21-Jun-51 | 1.75 | 19,600 | 4.47 | -0.09 | 0.00 | 4.56 | 4.38 |