
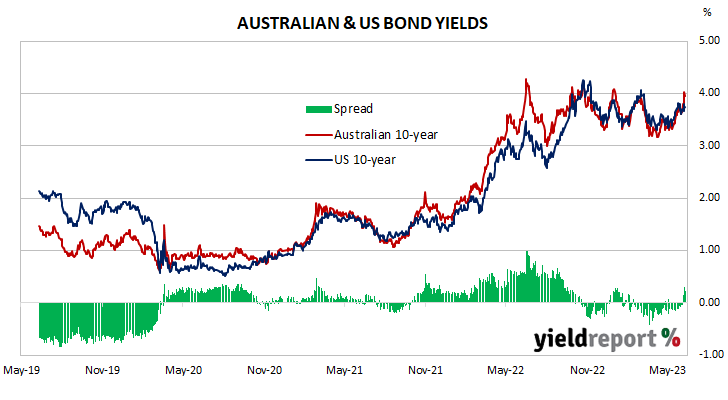
Summary: 10-year bond yield up in Australia; ACGB 10-year spread to US Treasury yield rises from -5bps to +22bps; 10-year bond yields up in US, UK, major European markets; $1.7 billion of bonds, notes issued by AOFM.
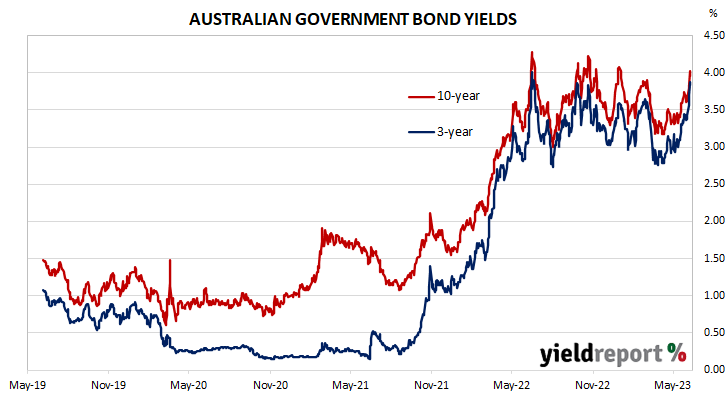
Locally, long-term ACGB yields jumped at the start of the week and kept rising over the next three days, especially on Thursday. The week ended with a moderate fall. By this point, the 3-year ACGB yield had increased by 40bps to 3.83%, the 10-year yield had gained 31bps to 3.96% while the 20-year yield finished 22bps higher at 4.26%. The spread between US and Australian 10-year Treasury bond yields widened from -5bps to +22bps.
Over in the US, 10-year bond yields slipped over the first two days of the week before running up hard on Wednesday. Yields then partially retraced before rising modestly at the end of the week.
The ISM’s May Services PMI was the only particularly notable report of the US week and it was released on Monday. The index fell from 51.9 to 50.3, below the generally expected figure of 52.4.
The Atlanta Fed’s Nowcast model was updated on Thursday. Its June quarter GDP growth estimate was raised from the previous week’s figure to 2.2% annualised, or a 0.5% expansion over the quarter.
By the end of the week, the US 2-year Treasury bond yield had gained 9bps to 4.60%, the 10-year yield had added 4bps to 3.74% while the 30-year yield finished unchanged at 3.88%.
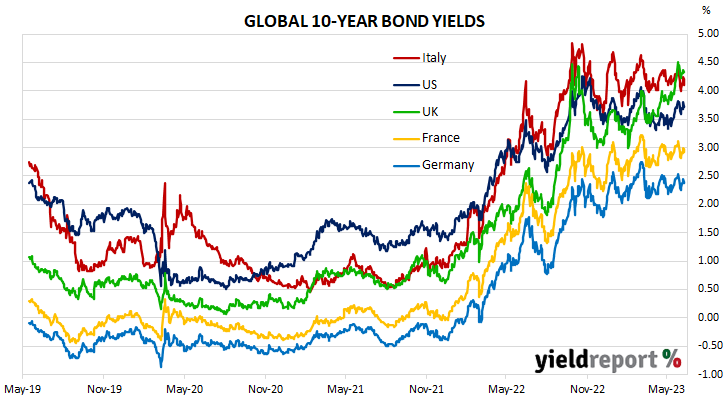
In major euro-zone markets, 10-year bond yields rose noticeably at the start of the week, slipped a little the next day and then increased significantly again midweek. Yields then fell back over.
By the end of the week, the German 10-year bond yield had gained 6bps to 2.37% while the French 10-year OAT yield had added 7bps to 2.92%. The Italian 10-year BTP yield increased by 4bps over the week to 4.10% while the British 10-year gilt yield finished 7bps higher at 4.34%.
The AOFM held one bond tender this week; $700 million of May 2034s were priced at a yield of 3.85%. There was also a Treasury note tender which raised $1 billion on a short-term basis.
The gross value of all bonds issued by the AOFM in the 2022/2023 financial year-to-date (not taking into account buy-backs or short-term Treasury note tenders) is $79.7 billion. There are currently $822.85 billion of Treasury bonds and $39.136 billion of Treasury index-linked bonds on issue. The next series to mature does so on 21 April 2024 when $35.90 billion worth of bonds are due. There are also $25.5 billion of short-term Treasury notes currently outstanding after $7 billion matured on Friday.
AUSTRALIAN GOVERNMENT BONDS
| MATURITY | COUPON (%) | ISSUE SIZE ($M) | CLOSING YIELD | Δ WEEK | Δ MONTH | WEEK HIGH | WEEK LOW |
|---|---|---|---|---|---|---|---|
| 21-Apr-24 | 2.75 | 35,900 | 4.22 | 0.31 | 0.71 | 4.24 | 3.98 |
| 21-Nov-24 | 0.25 | 41,300 | 4.10 | 0.33 | 0.88 | 4.16 | 3.87 |
| 21-Apr-25 | 3.25 | 41,500 | 4.00 | 0.35 | 0.92 | 4.04 | 3.76 |
| 21-Nov-25 | 0.25 | 39,200 | 3.87 | 0.38 | 0.92 | 3.92 | 3.62 |
| 21-Apr-26 | 4.25 | 39,600 | 3.83 | 0.40 | 0.87 | 3.87 | 3.56 |
| 21-Sep-26 | 0.50 | 37,800 | 3.81 | 0.39 | 0.84 | 3.86 | 3.56 |
| 21-Apr-27 | 4.75 | 36,700 | 3.80 | 0.38 | 0.82 | 3.85 | 3.56 |
| 21-Nov-27 | 2.75 | 31,400 | 3.80 | 0.38 | 0.80 | 3.84 | 3.56 |
| 21-May-28 | 2.25 | 30,200 | 3.79 | 0.37 | 0.77 | 3.84 | 3.56 |
| 21-Nov-28 | 2.75 | 34,100 | 3.80 | 0.36 | 0.75 | 3.85 | 3.58 |
| 21-Apr-29 | 3.25 | 36,600 | 3.82 | 0.35 | 0.73 | 3.87 | 3.61 |
| 21-Nov-29 | 2.75 | 34,700 | 3.85 | 0.34 | 0.71 | 3.90 | 3.65 |
| 21-May-30 | 2.50 | 37,100 | 3.87 | 0.34 | 0.70 | 3.93 | 3.67 |
| 21-Dec-30 | 1.00 | 38,700 | 3.90 | 0.33 | 0.67 | 3.95 | 3.71 |
| 21-Jun-31 | 1.50 | 38,100 | 3.92 | 0.32 | 0.66 | 3.98 | 3.74 |
| 21-Nov-31 | 1.00 | 21,000 | 3.93 | 0.31 | 0.64 | 3.99 | 3.76 |
| 21-May-32 | 1.25 | 39,300 | 3.94 | 0.31 | 0.64 | 4.01 | 3.77 |
| 21-Nov-32 | 1.75 | 29,000 | 3.95 | 0.31 | 0.63 | 4.01 | 3.78 |
| 21-Apr-33 | 4.50 | 24,400 | 3.95 | 0.31 | 0.63 | 4.01 | 3.78 |
| 21-Nov-33 | 3.00 | 21,100 | 3.97 | 0.30 | 0.62 | 4.03 | 3.80 |
| 21-May-34 | 3.75 | 18,100 | 3.98 | 0.30 | 0.62 | 4.04 | 3.82 |
| 21-Dec-34 | 3.50 | 14,800 | 4.01 | 0.29 | 0.61 | 4.07 | 3.85 |
| 21-Jun-35 | 2.75 | 11,550 | 4.03 | 0.28 | 0.59 | 4.10 | 3.89 |
| 21-Apr-37 | 3.75 | 12,300 | 4.13 | 0.26 | 0.55 | 4.18 | 4.00 |
| 21-Jun-39 | 3.25 | 10,300 | 4.21 | 0.24 | 0.51 | 4.26 | 4.10 |
| 21-May-41 | 2.75 | 13,800 | 4.27 | 0.23 | 0.48 | 4.32 | 4.16 |
| 21-Mar-47 | 3.00 | 14,200 | 4.31 | 0.20 | 0.45 | 4.36 | 4.21 |
| 21-Jun-51 | 1.75 | 19,300 | 4.31 | 0.19 | 0.44 | 4.36 | 4.21 |