
Summary: 10-year bond yield down in Australia; ACGB 10-year spread to US Treasury yield rises from -6bps to -5bps; 10-year bond yields down in US, UK, major European markets; $1.8 billion of bonds, notes issued by AOFM.
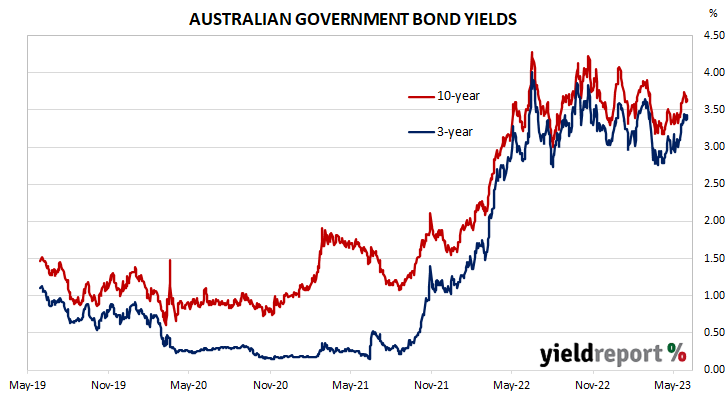
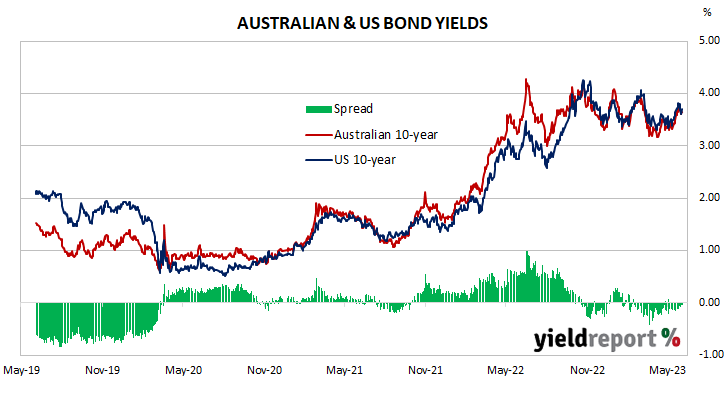
Locally, long-term ACGB yields started the week with a decline which continued over the next two days. Yields then reversed course and rose over the remainder of the week. By the end of it, the 3-year ACGB yield had slipped 1bp to 3.43%, the 10-year yield had lost 9bps to 3.65% while the 20-year yield finished 8bps lower at 4.04%. The spread between US and Australian 10-year Treasury bond yields “widened” from -6bps to -5bps.
Over in the US, 10-year bond yields fell over the first three days of the shortened week but then increased noticeably on Friday.
The Conference Board’s May reading of its Consumer Sentiment Index was released on Tuesday. The index lost ground again but remained above its long-term average.
April’s JOLTS report came out the next day and it indicated the US quit rate had slipped for a second consecutive month while maintaining a historically-high reading. Total quits and separations were down while openings were up.
The ISM’s May PMI report was released on Thursday. The latest reading of the PMI index declined further into contractionary territory.
The Atlanta Fed’s Nowcast model was also updated. Its June quarter GDP growth estimate was raised to 2.0% annualised, or a 0.5% expansion over the quarter.
At the end of the week, May’s non-farm payrolls report produced a rise in employment which was greater than expected. However, the jobless rate increased from 3.4% to 3.7% while the participation rate remained unchanged at 62.6%.
By this point, the US 2-year Treasury bond yield had lost 5bps to 4.51%, the 10-year yield had shed 10bps to 3.70% while the 30-year yield finished 8bps lower at 3.88%.
In major euro-zone markets, 10-year bond yields fell through the week until Friday when they reversed course.
The latest euro-zone’s Economic Sentiment Indicator (ESI) was released on Tuesday. The index fell in May, below its long-term average. This indicator has a solid correlation with euro-zone GDP and it implied a year-to-May growth rate of 0.5%, down from 1.1% in April.
The “flash” May consumer price index (CPI) report was released a couple of days later. It produced an annual inflation rate of 6.1% in the euro-zone, lower than the expected 6.3% as well as April’s final reading of 7.0%. Core annual CPI slowed from 5.6% to 5.3%.
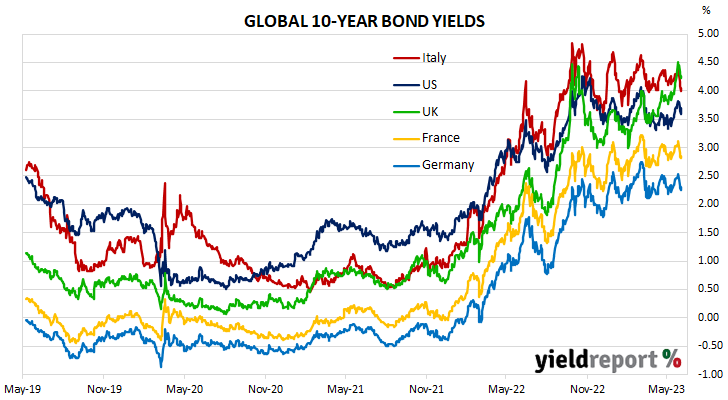
By the end of the week, the German 10-year bond yield had shed 23bps to 2.31% while the French 10-year OAT yield had lost 26bps to 2.85%. The Italian 10-year BTP yield fell by 33bps over the week to 4.06% while the British 10-year gilt yield finished 19bps lower at 4.27%.
The AOFM held two bond tenders this week. $300 million of June 2051s and $500 million of April 2026s were priced at yields of 4.11% and 3.35% respectively. There was also a Treasury note tender which raised $1 billion on a short-term basis.
The gross value of all bonds issued by the AOFM in the 2022/2023 financial year-to-date (not taking into account buy-backs or short-term Treasury note tenders) is $79.0 billion. There are currently $822.15 billion of Treasury bonds and $39.136 billion of Treasury index-linked bonds on issue. The next series to mature does so on 21 April 2024 when $35.90 billion worth of bonds are due. There are also $31.5 billion of short-term Treasury notes currently outstanding.
AUSTRALIAN GOVERNMENT BONDS
| MATURITY | COUPON (%) | ISSUE SIZE ($M) | CLOSING YIELD | Δ WEEK | Δ MONTH | WEEK HIGH | WEEK LOW |
|---|---|---|---|---|---|---|---|
| 21-Apr-24 | 2.75 | 35,900 | 3.91 | 0.13 | 0.54 | 3.91 | 3.79 |
| 21-Nov-24 | 0.25 | 41,300 | 3.77 | 0.09 | 0.63 | 3.77 | 3.65 |
| 21-Apr-25 | 3.25 | 41,500 | 3.65 | 0.06 | 0.61 | 3.65 | 3.54 |
| 21-Nov-25 | 0.25 | 39,200 | 3.49 | 0.02 | 0.52 | 3.49 | 3.41 |
| 21-Apr-26 | 4.25 | 39,600 | 3.43 | -0.01 | 0.43 | 3.43 | 3.37 |
| 21-Sep-26 | 0.50 | 37,800 | 3.42 | -0.02 | 0.41 | 3.43 | 3.37 |
| 21-Apr-27 | 4.75 | 36,700 | 3.42 | -0.02 | 0.39 | 3.43 | 3.37 |
| 21-Nov-27 | 2.75 | 31,400 | 3.42 | -0.03 | 0.37 | 3.44 | 3.37 |
| 21-May-28 | 2.25 | 30,200 | 3.43 | -0.04 | 0.35 | 3.45 | 3.38 |
| 21-Nov-28 | 2.75 | 34,100 | 3.44 | -0.05 | 0.33 | 3.47 | 3.40 |
| 21-Apr-29 | 3.25 | 36,600 | 3.47 | -0.06 | 0.34 | 3.50 | 3.42 |
| 21-Nov-29 | 2.75 | 34,700 | 3.50 | -0.06 | 0.33 | 3.54 | 3.45 |
| 21-May-30 | 2.50 | 37,100 | 3.53 | -0.07 | 0.32 | 3.58 | 3.49 |
| 21-Dec-30 | 1.00 | 38,700 | 3.57 | -0.08 | 0.31 | 3.62 | 3.53 |
| 21-Jun-31 | 1.50 | 38,100 | 3.60 | -0.07 | 0.31 | 3.64 | 3.55 |
| 21-Nov-31 | 1.00 | 21,000 | 3.62 | -0.08 | 0.31 | 3.67 | 3.58 |
| 21-May-32 | 1.25 | 39,300 | 3.63 | -0.08 | 0.31 | 3.69 | 3.59 |
| 21-Nov-32 | 1.75 | 29,000 | 3.64 | -0.09 | 0.31 | 3.70 | 3.60 |
| 21-Apr-33 | 4.50 | 24,400 | 3.64 | -0.09 | 0.31 | 3.70 | 3.60 |
| 21-Nov-33 | 3.00 | 21,100 | 3.67 | -0.09 | 0.31 | 3.72 | 3.63 |
| 21-May-34 | 3.75 | 17,400 | 3.68 | -0.09 | 0.30 | 3.74 | 3.64 |
| 21-Dec-34 | 3.50 | 14,800 | 3.72 | -0.09 | 0.30 | 3.78 | 3.68 |
| 21-Jun-35 | 2.75 | 11,550 | 3.76 | -0.09 | 0.29 | 3.81 | 3.72 |
| 21-Apr-37 | 3.75 | 12,300 | 3.87 | -0.08 | 0.29 | 3.91 | 3.83 |
| 21-Jun-39 | 3.25 | 10,300 | 3.97 | -0.08 | 0.27 | 4.01 | 3.94 |
| 21-May-41 | 2.75 | 13,800 | 4.04 | -0.08 | 0.26 | 4.08 | 4.02 |
| 21-Mar-47 | 3.00 | 14,200 | 4.11 | -0.08 | 0.27 | 4.16 | 4.09 |
| 21-Jun-51 | 1.75 | 19,300 | 4.12 | -0.09 | 0.27 | 4.16 | 4.10 |