
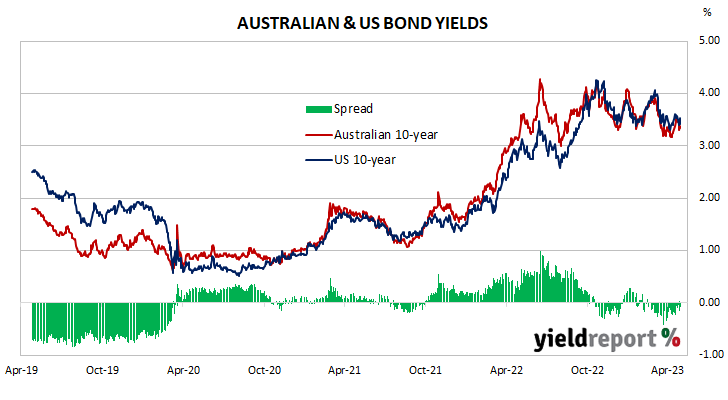
Summary: 10-year bond yield down in Australia; ACGB 10-year spread to US Treasury yield rises from -10bps to -8bps; 10-year bond yields down in US, major European markets; $1.5 billion of notes issued by AOFM.
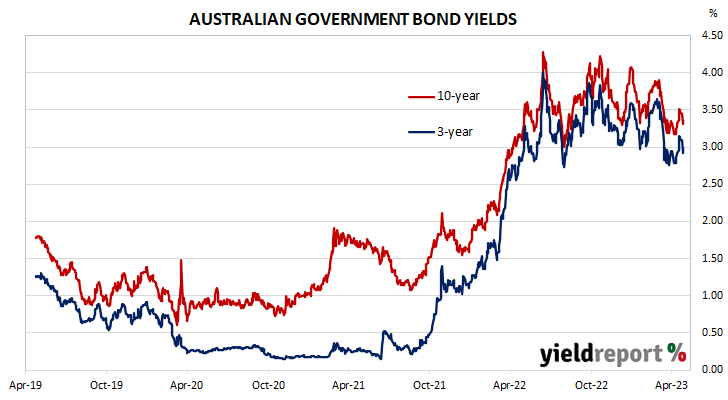
Locally, long-term ACGB yields stayed quiet at the start of the shortened week before diving midweek. Yields partially reversed on Thursday before sliding moderately at the end of the week. By this point, the 3-year ACGB yield had lost 12bps to 2.98%, the 10-year yield had shed 13bps to 3.34% while the 20-year yield finished 11bps lower at 3.78%. The spread between US and Australian 10-year Treasury bond yields “widened” from -10bps to -8bps.
Over in the US, 10-year bond yields started the week with a substantial fall which was repeated again the following day. Yields reversed course and rose over the next two days before dropping materially again at the end of the week.
The Conference Board’s April reading of its Consumer Sentiment Index was released on Tuesday. The index slipped a little but remained above its long-term average.
March quarter GDP figures were released on Thursday. The US economy expanded at a pace slower than expected, largely the result of inventory depletion.
At the end of the week, the latest report on personal consumption expenditures indicated core PCE price inflation had increased by 0.3% in March and by 4.6% on annual basis, down from 4.7% in February.
The Atlanta Fed’s Nowcast model was updated. The June quarter GDP growth estimate was increased to 1.7% annualised, or a 0.4% expansion over the quarter.
By this point, the US 2-year Treasury bond yield had shed 17bps to 4.00%, the 10-year yield had lost 15bps to 3.42% while the 30-year yield finished 10bps lower at 3.68%.
In major euro-zone markets, 10-year bond yields took a similar path to US Treasury bonds except they increased modestly on Monday instead of falling substantially as had US yields.
Germany’s ifo Institute released the April reading of its business climate index at the start of the week. The index increased for a sixth consecutive month, as firms’ views of current conditions deteriorated while their collective outlook improved.
The latest euro-zone’s Economic Sentiment Indicator (ESI) was released on Thursday. The index crept a touch higher in April, just short of its long-term average. This indicator has a solid correlation with euro-zone GDP and it implied a year-to-April growth rate of 1.2%, unchanged from March’s figure.
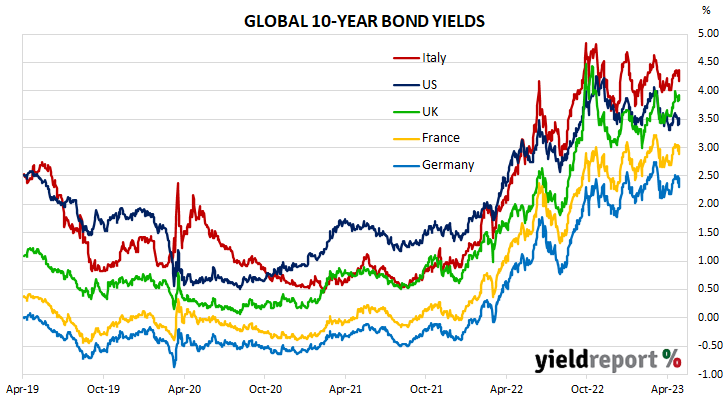
By the end of the week, the German 10-year bond yield had shed 17bps to 2.31% while the French 10-year OAT yield had lost 16bps to 2.89%. The Italian 10-year BTP yield decreased by 18bps over the week to 4.18% while the British 10-year gilt yield finished 6bps lower at 3.84%.
The AOFM held no bond tenders during the week. There were just two Treasury note tenders which raised a total of $1.5 billion on a short-term basis.
The gross value of all bonds issued by the AOFM in the 2022/2023 financial year-to-date (not taking into account buy-backs or short-term Treasury note tenders) is $74.80 billion. There are currently $818.25 billion of Treasury bonds and $38.836 billion of Treasury index-linked bonds on issue. The next series to mature does so on 21 April 2024 when $35.90 billion worth of bonds are due. There are also $37.50 billion of short-term Treasury notes currently outstanding.
AUSTRALIAN GOVERNMENT BONDS
| MATURITY | COUPON (%) | ISSUE SIZE ($M) | CLOSING YIELD | Δ WEEK | Δ MONTH | WEEK HIGH | WEEK LOW |
|---|---|---|---|---|---|---|---|
| 21-Apr-24 | 2.75 | 35,900 | 3.37 | -0.09 | 0.29 | 3.42 | 3.28 |
| 21-Nov-24 | 0.25 | 41,300 | 3.15 | -0.15 | 0.19 | 3.25 | 3.09 |
| 21-Apr-25 | 3.25 | 41,500 | 3.03 | -0.16 | 0.17 | 3.15 | 2.97 |
| 21-Nov-25 | 0.25 | 39,200 | 2.97 | -0.16 | 0.15 | 3.09 | 2.91 |
| 21-Apr-26 | 4.25 | 39,100 | 3.00 | -0.17 | 0.15 | 3.12 | 2.95 |
| 21-Sep-26 | 0.50 | 37,800 | 3.01 | -0.16 | 0.14 | 3.13 | 2.96 |
| 21-Apr-27 | 4.75 | 36,700 | 3.03 | -0.16 | 0.13 | 3.15 | 2.98 |
| 21-Nov-27 | 2.75 | 31,400 | 3.05 | -0.17 | 0.12 | 3.18 | 3.01 |
| 21-May-28 | 2.25 | 30,200 | 3.08 | -0.17 | 0.12 | 3.20 | 3.03 |
| 21-Nov-28 | 2.75 | 34,100 | 3.11 | -0.17 | 0.11 | 3.23 | 3.06 |
| 21-Apr-29 | 3.25 | 35,800 | 3.13 | -0.17 | 0.11 | 3.26 | 3.10 |
| 21-Nov-29 | 2.75 | 34,700 | 3.18 | -0.17 | 0.12 | 3.30 | 3.15 |
| 21-May-30 | 2.50 | 37,100 | 3.21 | -0.17 | 0.12 | 3.33 | 3.18 |
| 21-Dec-30 | 1.00 | 38,700 | 3.26 | -0.17 | 0.11 | 3.37 | 3.23 |
| 21-Jun-31 | 1.50 | 38,100 | 3.28 | -0.16 | 0.11 | 3.40 | 3.25 |
| 21-Nov-31 | 1.00 | 21,000 | 3.31 | -0.16 | 0.12 | 3.42 | 3.28 |
| 21-May-32 | 1.25 | 39,300 | 3.32 | -0.16 | 0.12 | 3.43 | 3.29 |
| 21-Nov-32 | 1.75 | 29,000 | 3.33 | -0.16 | 0.12 | 3.44 | 3.30 |
| 21-Apr-33 | 4.50 | 23,600 | 3.34 | -0.16 | 0.12 | 3.45 | 3.30 |
| 21-Nov-33 | 3.00 | 21,100 | 3.36 | -0.16 | 0.12 | 3.47 | 3.33 |
| 21-May-34 | 3.75 | 17,400 | 3.38 | -0.16 | 0.11 | 3.49 | 3.35 |
| 21-Dec-34 | 3.50 | 14,000 | 3.42 | -0.16 | 3.42 | 3.53 | 3.39 |
| 21-Jun-35 | 2.75 | 10,850 | 3.46 | -0.16 | 0.11 | 3.57 | 3.43 |
| 21-Apr-37 | 3.75 | 12,300 | 3.58 | -0.16 | 0.11 | 3.68 | 3.55 |
| 21-Jun-39 | 3.25 | 10,300 | 3.70 | -0.14 | 0.11 | 3.79 | 3.66 |
| 21-May-41 | 2.75 | 13,800 | 3.79 | -0.12 | 0.10 | 3.87 | 3.75 |
| 21-Mar-47 | 3.00 | 14,200 | 3.84 | -0.12 | 0.07 | 3.93 | 3.82 |
| 21-Jun-51 | 1.75 | 19,000 | 3.85 | -0.12 | 0.08 | 3.94 | 3.83 |