
Summary: 10-year bond yield up in Australia; ACGB 10-year spread to US Treasury yield rises from -22bps to -20bps; 10-year bond yields up in US, major European markets; $3.4 billion of bonds, notes issued by AOFM.
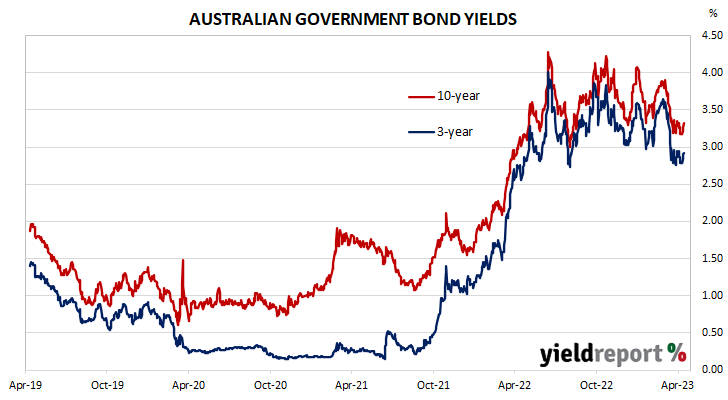
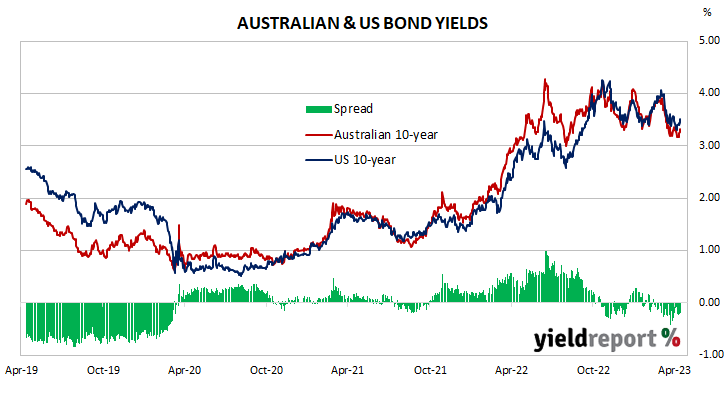
Locally, long-term ACGB yields started the shortened week with a moderate rise which set the tone for the remainder of the week. By the end of it, 3-year and 10-year ACGB yields had both gained 14bps to 2.92% and 3.32% respectively while the 20-year yield finished 13bps higher at 3.77%. The spread between US and Australian 10-year Treasury bond yields “widened” from -22bps to -20bps.
Over in the US, 10-year bond yields started the week with a modest rise which was followed the next day by another. Yields fell back midweek but then increased through the remainder of the week.
March’s CPI report was released midweek (US time) and it produced a 0.1% increase, well short of expectations. The annual inflation rate slowed from 6.0% to 5.0% while the core inflation rate ticked up from 5.5% to 5.6%.
The minutes from the FOMC’s April meeting were released on the same day. They made references to the recent ructions in the US banking system but the FOMC generally seemed fairly unchanged in its approach to dealing with high US inflation rates.
March producer price indices were released on Thursday. The index decreased by 0.5% over the month, in contrast with the expected flat result. The annual growth rate fell back from 5.0% to 2.8%.
The Atlanta Fed’s Nowcast model was also updated. The March quarter GDP growth estimate was raised to 2.5% annualised, or a 0.6% expansion over the quarter.
A bunch of reports were released at the end of the week.
Industrial production increased by 0.4% in March, more than the expected 0.3% increase. This latest reading implied annual GDP growth of 2.1%.
March’s retail sales report was also released and it indicated total sales had fallen by 1.0% over the month, a greater fall than the 0.5% one expected. Fuel sales had the largest effect on the overall result.
The University of Michigan’s Consumer sentiment index remained “essentially unchanged” as it increased modestly in April. The index remains well below its long-term average.
By this point, the US 2-year Treasury bond yield had gained 15bps to 4.11% while 10-year and 30-year yields both finished 12bps higher at 3.52% and 3.745 respectively.
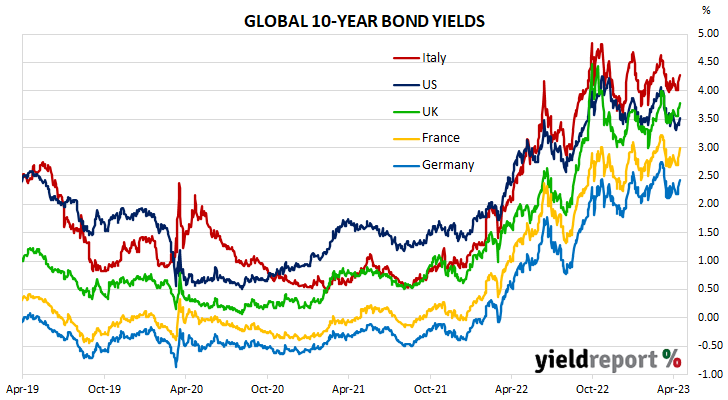
In major euro-zone markets, 10-year bond yields rose through the entire week and especially so at the week’s beginning and end.
The euro-zone’s February industrial production figures were released on Thursday. Output expanded by 1.5% in February, better than expected, and more than January’s 1.0% expansion.
By the end of the week, the German 10-year bond yield had gained 26bps to 2.44% while the French 10-year OAT yield had added 30bps to 3.00%. The Italian 10-year BTP yield increased by 26bps over the week to 4.28% while the British 10-year gilt yield finished 23bps higher at 3.79%.
The AOFM held one index-linked bond tender as well as a vanilla bond tender during the week. $100 million of November 2032 ILBs were priced at a real yield of 0.98% while $800 million of April 2033s were priced at a yield of 3.03%. There were also three Treasury note tenders which raised a total of $2.5 billion on a short-term basis.
The gross value of all bonds issued by the AOFM in the 2022/2023 financial year-to-date (not taking into account buy-backs or short-term Treasury note tenders) is $60.80 billion. There are currently $838.45 billion of Treasury bonds and $38.836 billion of Treasury index-linked bonds on issue. The next series to mature does so on 21 April 2023 when $34.20 billion worth of bonds are due. There are also $34.50 billion of short-term Treasury notes currently outstanding after $1 billion matured on Friday.
AUSTRALIAN GOVERNMENT BONDS
| MATURITY | COUPON (%) | ISSUE SIZE ($M) | CLOSING YIELD | Δ WEEK | Δ MONTH | WEEK HIGH | WEEK LOW |
|---|---|---|---|---|---|---|---|
| 21-Apr-23 | 5.50 | 34,200 | 3.67 | 0.25 | 0.20 | 3.67 | 3.50 |
| 21-Apr-24 | 2.75 | 35,900 | 3.22 | 0.11 | -0.02 | 3.22 | 3.15 |
| 21-Nov-24 | 0.25 | 41,300 | 3.07 | 0.14 | -0.05 | 3.07 | 2.99 |
| 21-Apr-25 | 3.25 | 41,500 | 2.97 | 0.14 | -0.06 | 2.97 | 2.88 |
| 21-Nov-25 | 0.25 | 39,200 | 2.92 | 0.13 | -0.07 | 2.92 | 2.84 |
| 21-Apr-26 | 4.25 | 39,100 | 2.95 | 0.14 | -0.06 | 2.95 | 2.87 |
| 21-Sep-26 | 0.50 | 37,800 | 2.96 | 0.14 | -0.08 | 2.96 | 2.88 |
| 21-Apr-27 | 4.75 | 36,700 | 2.99 | 0.13 | -0.08 | 2.99 | 2.91 |
| 21-Nov-27 | 2.75 | 31,400 | 3.02 | 0.14 | -0.08 | 3.02 | 2.94 |
| 21-May-28 | 2.25 | 30,200 | 3.04 | 0.14 | -0.09 | 3.04 | 2.96 |
| 21-Nov-28 | 2.75 | 34,100 | 3.07 | 0.14 | -0.09 | 3.07 | 2.99 |
| 21-Apr-29 | 3.25 | 35,800 | 3.11 | 0.13 | -0.09 | 3.11 | 3.03 |
| 21-Nov-29 | 2.75 | 34,700 | 3.16 | 0.13 | -0.08 | 3.16 | 3.07 |
| 21-May-30 | 2.50 | 37,100 | 3.19 | 0.13 | -0.08 | 3.19 | 3.10 |
| 21-Dec-30 | 1.00 | 38,700 | 3.24 | 0.13 | -0.08 | 3.24 | 3.15 |
| 21-Jun-31 | 1.50 | 38,100 | 3.26 | 0.13 | -0.08 | 3.26 | 3.17 |
| 21-Nov-31 | 1.00 | 21,000 | 3.29 | 0.13 | -0.08 | 3.29 | 3.19 |
| 21-May-32 | 1.25 | 39,300 | 3.30 | 0.14 | -0.08 | 3.30 | 3.21 |
| 21-Nov-32 | 1.75 | 29,000 | 3.32 | 0.14 | -0.07 | 3.32 | 3.22 |
| 21-Apr-33 | 4.50 | 23,600 | 3.32 | 0.14 | -0.07 | 3.32 | 3.22 |
| 21-Nov-33 | 3.00 | 21,100 | 3.35 | 0.14 | -0.08 | 3.35 | 3.25 |
| 21-May-34 | 3.75 | 17,400 | 3.37 | 0.14 | -0.08 | 3.37 | 3.27 |
| 21-Jun-35 | 2.75 | 10,850 | 3.45 | 0.14 | -0.08 | 3.45 | 3.35 |
| 21-Apr-37 | 3.75 | 12,300 | 3.57 | 0.13 | -0.08 | 3.57 | 3.46 |
| 21-Jun-39 | 3.25 | 10,300 | 3.68 | 0.13 | -0.09 | 3.68 | 3.57 |
| 21-May-41 | 2.75 | 13,800 | 3.76 | 0.12 | -0.09 | 3.76 | 3.65 |
| 21-Mar-47 | 3.00 | 14,200 | 3.83 | 0.10 | -0.07 | 3.83 | 3.73 |
| 21-Jun-51 | 1.75 | 19,000 | 3.83 | 0.10 | -0.04 | 3.83 | 3.73 |