
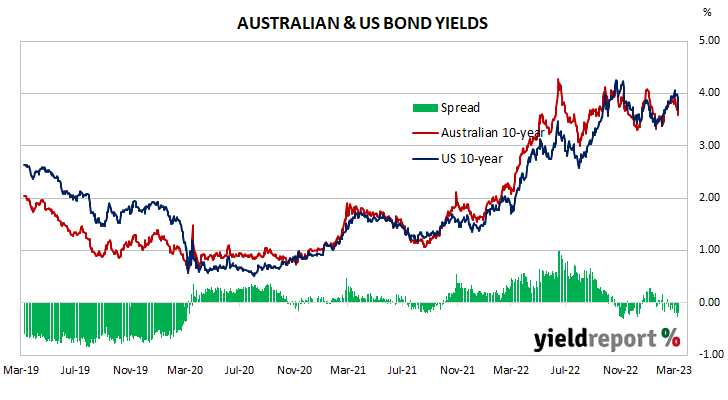
Summary: 10-year bond yields down in Australia; ACGB 10-year spread to US Treasury yield falls from -5bps to -11bps; 10-year bond yields down in US, major European markets; $4.0 billion of bonds, notes issued by AOFM.
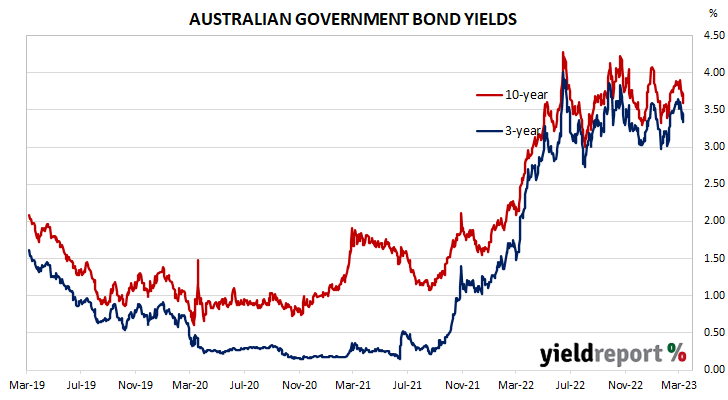
Locally, long-term ACGB yields started the week with a heavy fall which was continued the next day. A moderate rise midweek was then followed by another two days of falling yields. By the end of the week, the 3-year ACGB yield had lost 28bps to 3.33%, the 10-year yield had shed 32bps to 3.59% while the 20-year yield finished 25bps lower at 3.97%. The spread between US and Australian 10-year Treasury bond yields “tightened” from -5bps to -11bps.
Over in the US, 10-year bond yields started the week quietly, rose modestly over the following two days before falling noticeably on Thursday and plunging on Friday.
January’s JOLTS report came out mid-week and it indicated the US quit rate declined from 2.6% to 2.5%. Quits, separations and openings for the month all decreased.
The Atlanta Fed’s Nowcast model was also updated. The March quarter GDP growth estimate was raised to 2.6% annualised, or a 0.6% expansion over the quarter.
At the end of the week, February’s non-farm payrolls report produced another rise in employment which exceeded expectations. However, the jobless rate increased from 3.4% to 3.6% as the participation rate ticked up to 62.4%.
By this point, the US 2-year Treasury bond yield had lost 28bps to 4.59%, the 10-year yield had shed 26bps to 3.70% while the 30-year yield finished 17bps lower at 3.71%.
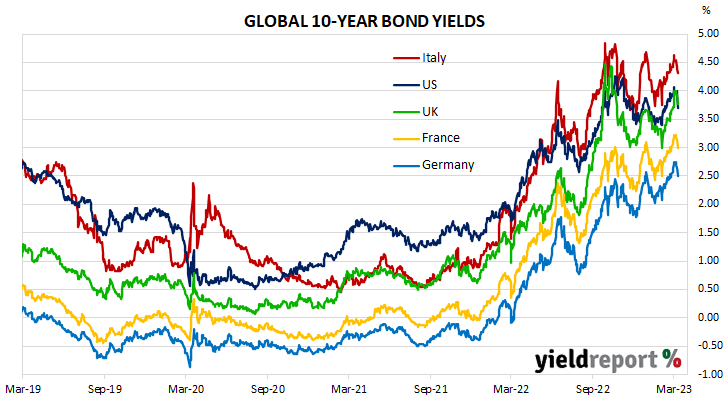
In major euro-zone markets, 10-year bond yields modestly at the start of the week but then fell away over much of week, with markedly lower yields at the end of the week.
By the end of the week, the German 10-year bond yield had shed 21bps to 2.50% while the French 10-year OAT yield had lost 19bps to 3.00%. The Italian 10-year BTP yield decreased by 22bps over the week to 4.31% while the British 10-year gilt yield finished 22bps lower at 3.77%.
The AOFM held two vanilla bond tenders during the week. $500 million of September 2026s and $500 million of June 2035s were priced at yields of 3.56% and 3.82% respectively. There were also three Treasury note tenders which raised a total of $3.0 billion on a short-term basis.
The gross value of all bonds issued by the AOFM in the 2022/2023 financial year-to-date (not taking into account buy-backs or short-term Treasury note tenders) is $55.35 billion. There are currently $833.35 billion of Treasury bonds and $38.486 billion of Treasury index-linked bonds on issue. The next series to mature does so on 21 April 2023 when $34.20 billion worth of bonds are due. There are also $29.00 billion of short-term Treasury notes currently outstanding after $4.50 billion matured on Friday.
AUSTRALIAN GOVERNMENT BONDS
| MATURITY | COUPON (%) | ISSUE SIZE ($M) | CLOSING YIELD | Δ WEEK | Δ MONTH | WEEK HIGH | WEEK LOW |
|---|---|---|---|---|---|---|---|
| 21-Apr-23 | 5.50 | 34,200 | 3.59 | 0.01 | 0.08 | 3.60 | 3.58 |
| 21-Apr-24 | 2.75 | 35,900 | 3.56 | -0.19 | -0.01 | 3.67 | 3.56 |
| 21-Nov-24 | 0.25 | 41,300 | 3.44 | -0.21 | 0.00 | 3.57 | 3.44 |
| 21-Apr-25 | 3.25 | 41,500 | 3.37 | -0.23 | -0.02 | 3.51 | 3.37 |
| 21-Nov-25 | 0.25 | 38,700 | 3.32 | -0.26 | -0.07 | 3.50 | 3.32 |
| 21-Apr-26 | 4.25 | 38,600 | 3.33 | -0.27 | -0.08 | 3.51 | 3.33 |
| 21-Sep-26 | 0.50 | 37,800 | 3.36 | -0.27 | -0.09 | 3.54 | 3.36 |
| 21-Apr-27 | 4.75 | 36,700 | 3.37 | -0.27 | -0.10 | 3.55 | 3.37 |
| 21-Nov-27 | 2.75 | 31,400 | 3.38 | -0.28 | -0.10 | 3.56 | 3.38 |
| 21-May-28 | 2.25 | 30,200 | 3.40 | -0.28 | -0.10 | 3.57 | 3.40 |
| 21-Nov-28 | 2.75 | 34,100 | 3.41 | -0.29 | -0.11 | 3.59 | 3.41 |
| 21-Apr-29 | 3.25 | 35,000 | 3.43 | -0.31 | -0.12 | 3.61 | 3.43 |
| 21-Nov-29 | 2.75 | 34,700 | 3.46 | -0.31 | -0.13 | 3.64 | 3.46 |
| 21-May-30 | 2.50 | 37,100 | 3.49 | -0.31 | -0.12 | 3.67 | 3.49 |
| 21-Dec-30 | 1.00 | 38,700 | 3.53 | -0.31 | -0.13 | 3.70 | 3.53 |
| 21-Jun-31 | 1.50 | 38,100 | 3.55 | -0.31 | -0.13 | 3.72 | 3.55 |
| 21-Nov-31 | 1.00 | 21,000 | 3.57 | -0.31 | -0.12 | 3.74 | 3.57 |
| 21-May-32 | 1.25 | 39,300 | 3.57 | -0.32 | -0.13 | 3.75 | 3.57 |
| 21-Nov-32 | 1.75 | 29,000 | 3.58 | -0.32 | -0.13 | 3.76 | 3.58 |
| 21-Apr-33 | 4.50 | 23,600 | 3.58 | -0.32 | -0.13 | 3.76 | 3.58 |
| 21-Nov-33 | 3.00 | 20,400 | 3.61 | -0.32 | -0.13 | 3.79 | 3.61 |
| 21-May-34 | 3.75 | 15,600 | 3.63 | -0.32 | -0.14 | 3.81 | 3.63 |
| 21-Jun-35 | 2.75 | 10,050 | 3.71 | -0.32 | -0.14 | 3.89 | 3.71 |
| 21-Apr-37 | 3.75 | 12,300 | 3.80 | -0.30 | -0.14 | 3.96 | 3.80 |
| 21-Jun-39 | 3.25 | 10,300 | 3.89 | -0.28 | -0.13 | 4.04 | 3.89 |
| 21-May-41 | 2.75 | 13,800 | 3.96 | -0.26 | -0.12 | 4.08 | 3.96 |
| 21-Mar-47 | 3.00 | 14,200 | 4.00 | -0.25 | -0.11 | 4.10 | 4.00 |
| 21-Jun-51 | 1.75 | 19,000 | 3.97 | -0.23 | -0.10 | 4.06 | 3.97 |