
Summary: 10-year bond yields up in Australia, the US, major European markets; ACGB 10-year spread to US Treasury yield widens from +53bps to +56bps; AOFM issues $3 billion worth of bonds, notes.
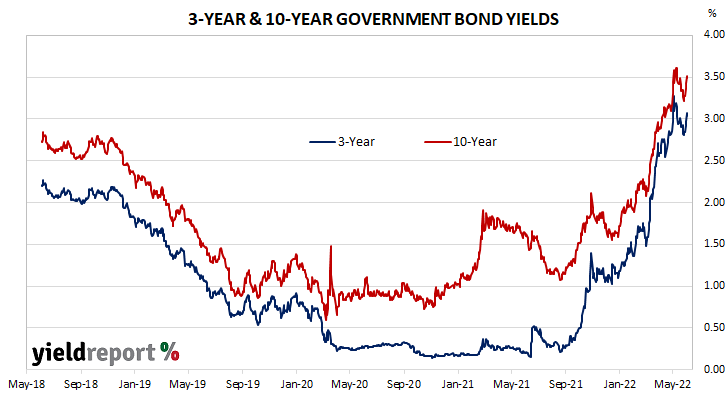
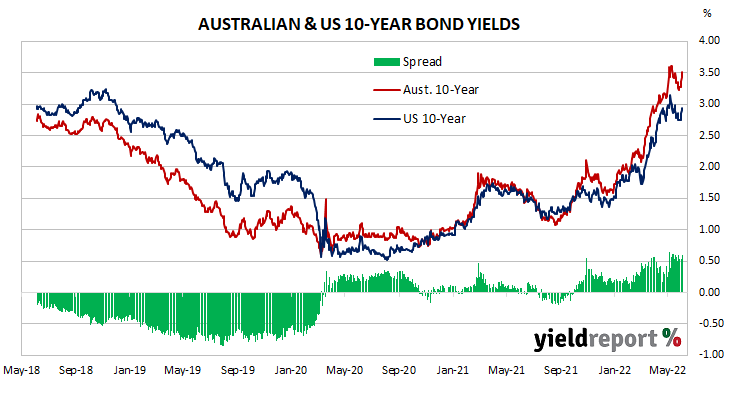
Locally, long-term ACGB yields rose from the beginning of the week through to its end. By this point, the 3-year ACGB yield had gained 20bps to 3.04%, the 10-year yield had risen by 23bps to 3.50% while the 20-year yield finished 20bps higher at 3.80%. The spread between US and Australian 10-year Treasury bond yields widened from +53bps to +56bps.
Over in the US, long-term bond yields started sedately enough but then rose over the remainder of the week with just a day’s pause on Thursday.
The Conference Board’s May reading of its Consumer Sentiment Index was released on Tuesday. The index deteriorated a little but remained at an above-average level.
The next day, The ISM’s May Manufacturing PMI moved a little higher, beating expectations. In contrast to April’s report, US labour shortages were said to be easing.
April’s JOLTS report came out the next day. It indicated the US quit rate remained unchanged after revisions, just short of its all-time high. Job openings and separations both decreased.
On Thursday, the ADP April report undershot market expectations for a second consecutive month.
At the end of the week, May’s non-farm payrolls report produced a rise in employment above expectations. The jobless rate remained unchanged at 3.6% while the participation rate ticked up to 62.3%.
By this stage, the US 2-year Treasury bond yield had jumped 22bps to 2.68%, the 10-year yield had gained 20bps to 2.94% while the 30-year yield finished 12bps higher at 3.09%.
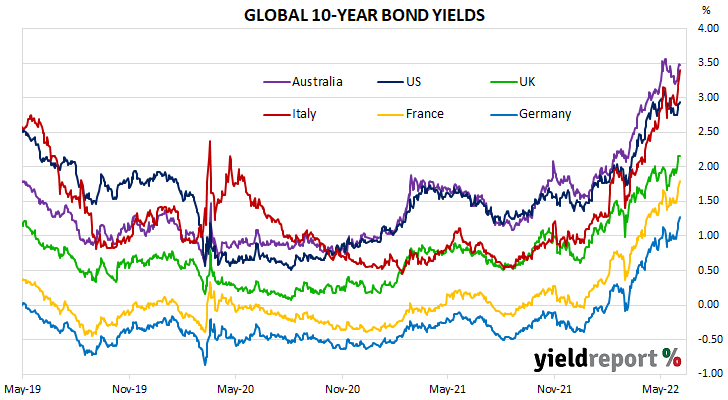
In major euro-zone markets, 10-year bond yields rose on each and every day of the week.
The euro-zone’s Economic Sentiment Indicator (ESI) was released at the start of the week. It inched up in May, ticking up from 104.9 to 105.0. This indicator has a solid correlation with euro-zone GDP and it implies a year-to-May growth rate of 2.6%.
The next day, the “flash” May consumer price index (CPI) report produced an annual inflation rate of 8.1% in the euro-zone, above expectations and April’s final reading of 7.4%. Energy prices had the largest effect as they increased by 39.2% over the year. Core annual CPI increased from 3.5% to 3.8%.
The latest producer price indices were released on Thursday. They rose by 1.2% in April, taking the annual rate of price growth from 36.9% to 37.2%.
By the end of the week, the German 10-year bund yield had jumped 31bps to 1.27% while the French 10-year OAT yield had gained 32bps to 1.79%. The Italian 10-year BTP yield added 49bps to 2.90% over the week while the British 10-year gilt yield finished 24bps higher at 2.16%.
The AOFM held just the one bond tender during the week. $1 billion of April 2025s were priced at a yield of 2.90%.
There were also two Treasury note tenders which raised $2 billion on a short-term basis.
The gross value of all bonds issued by the AOFM in the 2021/2022 financial year-to-date (not taking into account buy-backs or short-term Treasury note tenders) is $98.3 billion. There are currently $826.213 billion of Treasury bonds and $36.986 billion of Treasury index-linked bonds on issue. The next series to mature does so on 15 July when $24.763 billion worth of bonds are due. There are also $26.75 billion of short-term Treasury notes currently outstanding.
| MATURITY | COUPON (%) | ISSUE SIZE ($M) | CLOSING YIELD | Δ WEEK | Δ MONTH | WEEK HIGH | WEEK LOW |
|---|---|---|---|---|---|---|---|
| 21-Nov-22 | 2.25 | 26,500 | 1.47 | 0.15 | 0.31 | 1.49 | 1.33 |
| 21-Apr-23 | 5.50 | 34,200 | 2.14 | 0.24 | 0.31 | 2.17 | 1.93 |
| 21-Apr-24 | 2.75 | 35,900 | 2.60 | 0.21 | 0.15 | 2.63 | 2.40 |
| 21-Nov-24 | 0.25 | 40,600 | 2.83 | 0.21 | 0.24 | 2.86 | 2.63 |
| 21-Apr-25 | 3.25 | 39,100 | 2.95 | 0.21 | 0.24 | 2.99 | 2.76 |
| 21-Nov-25 | 0.25 | 22,000 | 3.08 | 0.22 | 0.27 | 3.11 | 2.87 |
| 21-Apr-26 | 4.25 | 38,100 | 3.11 | 0.23 | 0.28 | 3.14 | 2.90 |
| 21-Sep-26 | 0.50 | 33,800 | 3.16 | 0.23 | 0.28 | 3.19 | 2.95 |
| 21-Apr-27 | 4.75 | 34,600 | 3.18 | 0.23 | 0.29 | 3.21 | 2.97 |
| 21-Nov-27 | 2.75 | 30,700 | 3.24 | 0.24 | 0.29 | 3.27 | 3.03 |
| 21-May-28 | 2.25 | 29,700 | 3.30 | 0.24 | 0.31 | 3.32 | 3.08 |
| 21-Nov-28 | 2.75 | 32,600 | 3.33 | 0.25 | 0.32 | 3.35 | 3.10 |
| 21-Apr-29 | 3.25 | 33,000 | 3.35 | 0.25 | 0.33 | 3.37 | 3.12 |
| 21-Nov-29 | 2.75 | 33,400 | 3.39 | 0.26 | 0.35 | 3.41 | 3.16 |
| 21-May-30 | 2.50 | 37,100 | 3.42 | 0.26 | 0.36 | 3.44 | 3.19 |
| 21-Dec-30 | 1.00 | 24,700 | 3.45 | 0.23 | 0.36 | 3.47 | 3.22 |
| 21-Jun-31 | 1.50 | 38,100 | 3.46 | 0.23 | 0.36 | 3.48 | 3.23 |
| 21-Nov-31 | 1.00 | 21,000 | 3.47 | 0.23 | 0.36 | 3.49 | 3.24 |
| 21-May-32 | 1.25 | 34,200 | 3.48 | 0.23 | 0.36 | 3.50 | 3.25 |
| 21-Apr-33 | 4.50 | 19,800 | 3.50 | 0.23 | 0.36 | 3.51 | 3.27 |
| 21-Jun-35 | 2.75 | 9,550 | 3.62 | 0.25 | 0.39 | 3.63 | 3.39 |
| 21-Apr-37 | 3.75 | 12,000 | 3.68 | 0.25 | 0.40 | 3.69 | 3.46 |
| 21-Jun-39 | 3.25 | 10,300 | 3.74 | 0.23 | 0.39 | 3.75 | 3.54 |
| 21-May-41 | 2.75 | 13,500 | 3.80 | 0.23 | 0.38 | 3.80 | 3.59 |
| 21-Mar-47 | 3.00 | 13,300 | 3.83 | 0.24 | 0.38 | 3.83 | 3.71 |
| 21-Jun-51 | 1.75 | 15,000 | 3.80 | 0.24 | 0.36 | 3.80 | 3.59 |