
Summary: ACGB bond yields up in Australia; ACGB 10-year spread to US Treasury yield rises to +18bps; 10-year bond yields up in US, major European markets; $2.8 billion of bonds, notes issued by AOFM.
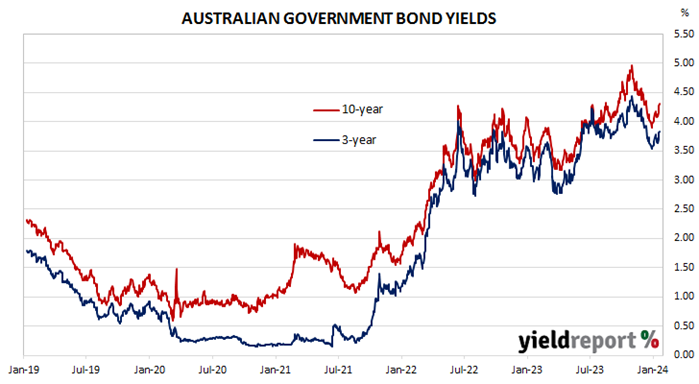
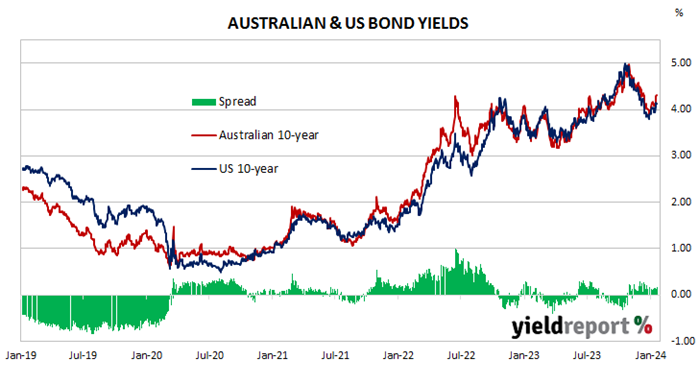
Locally, long-term ACGB yields started with a rise which continued through the remainder of the week. By the end of it, the 3-year ACGB yield had gained 19bps to 3.84%, the 10-year yield had added 23bps to 4.31% while the 20-year yield finished 20bps higher at 4.60%. The spread between US and Australian 10-year Treasury bond yields rose from 14bps to 18bps.
Over in the US, 10-year bond yields rose through the shortened week until Friday when yields slipped back a touch.
December’s retail sales report was released midweek along with December industrial production figures. Total sales increased by 0.6% over the month, better than expected. Industrial production expanded by just 0.1%, slightly above the flat result which had been generally expected.
The latest reading of the University of Michigan’s Consumer Sentiment index came out at the end of the week. The index increased markedly for a second consecutive month and the UoM index is now back in broadly neutral territory.
The US Fed’s Nowcast model was also updated as usual. The December quarter GDP growth forecast remained at 2.4% annualised, or a 0.6% expansion over the quarter. The March 2024 quarter forecast was reduced from 2.5% to 2.4%.
By this point, the US 2-year Treasury bond yield had gained 24bps to 4.37%, the 10-year yield had added 19bps to 4.13% while the 30-year yield finished 15bps higher at 4.33%.
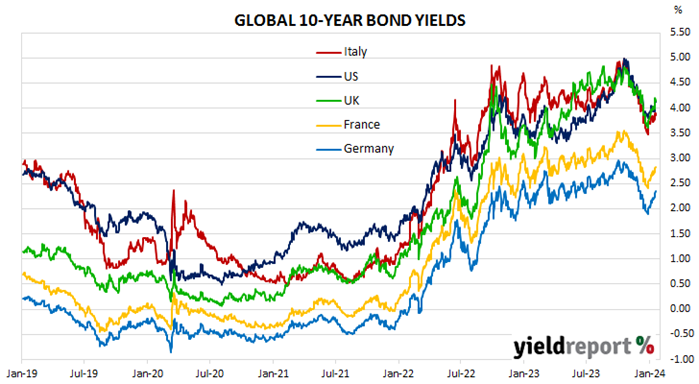
In major euro-zone markets, 10-year bond yields followed a similar path their US counterpart except for their rises at the start of the week when US markets was closed.
The euro-zone’s November industrial production figures were released at the start of the week. Output contracted by 0.3% over the month, a smaller contraction than expected.
By the end of the week, the German 10-year bund yield had gained 15bps to 2.34% while the French 10-year OAT yield had increased by 15bps to 2.82%. The Italian 10-year BTP yield also added 15bps, to 3.87%, while the British 10-year gilt yield finished 17bps higher at 4.15%.
The AOFM held just the usual vanilla bond tender this week; $800 million of December 2034s were priced at a nominal yield of 4.23%. There were also two Treasury note tenders which raised $2.0 billion on a short-term basis.
The gross value of all bonds issued by the AOFM in the 2023/2024 financial year (not taking into account buy-backs or short-term Treasury note tenders) is $25.50 billion. There are currently $848.25 billion of Treasury bonds and $40.686 billion of Treasury index-linked bonds on issue. The next series to mature does so on 21 April 2024 when $35.90 billion worth of bonds are due. There are also $25.00 billion of short-term Treasury notes outstanding.