
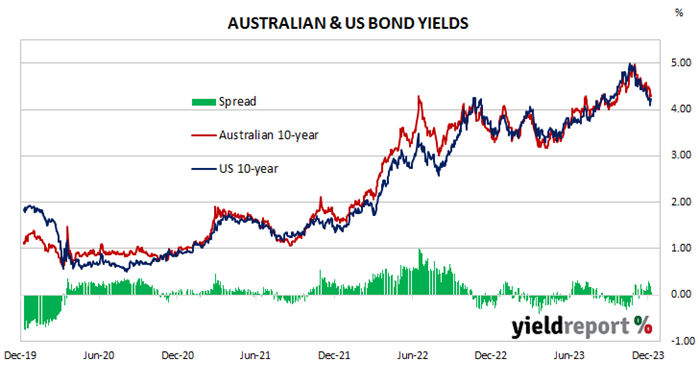
Summary: 10-year bond yield down in Australia; ACGB 10-year spread to US Treasury yield falls to +9bps; 10-year bond yields up in US, down in major European markets; $2.7 billion of bonds, notes issued by AOFM.
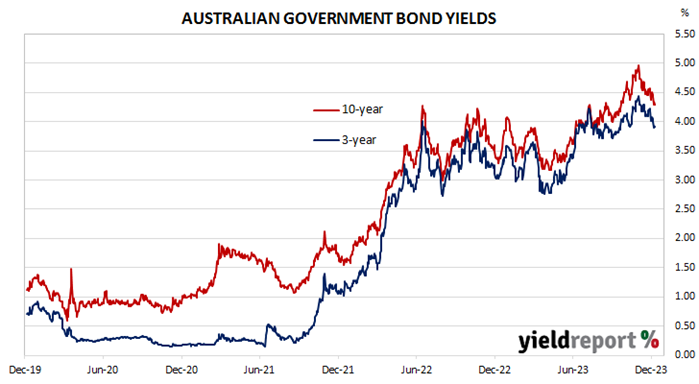
Locally, long-term ACGB yields fell through the week with the exception of Thursday after a modest bounce following a heavy fall midweek. By the end of the week, the 3-year ACGB yield had shed 17bps to 3.91%, the 10-year yield had lost 20bps to 4.30% while the 20-year yield finished 19bps lower at 4.61%. The spread between US and Australian 10-year Treasury bond yields fell from 30bps to 7bps.
Over in the US, 10-year bond yields increased at the start of the week before falling noticeably over the next two days. Yields resumed rising until the end of the week.
October’s JOLTS report was released on Tuesday. Total quits and separations declined while openings were higher. produced a steady US quit rate.
The ISM’s November Services PMI was also released. The index rose from 51.8 to 52.7, higher than expected.
Midweek, the ADP’s November payrolls report undershot market expectations again.
At the end of the week, November’s non-farm payrolls report produced a rise in employment which was in line with expectations. The jobless rate fell to 3.7% and the participation rate ticked up to 62.8%.
The latest reading of the University of Michigan’s Consumer Sentiment index also came out. Sentiment improved markedly after deteriorating for the previous four consecutive months.
The US Fed’s Nowcast model was updated as usual. The December quarter GDP growth forecast remained unchanged at 2.3% annualised, or a 0.6% expansion over the quarter.
By this point, the US 2-year Treasury bond yield had gained 18bps to 4.72%, the 10-year yield had added 3bps to 4.23% while the 30-year yield finished 8bps lower at 4.31%.
In major euro-zone markets, 10-year bond yields fell each day with the exception of Friday when yields rose materially.
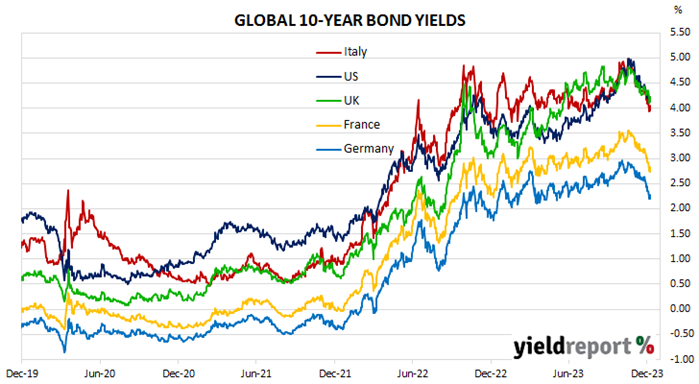
By the end of the week, the German 10-year bund yield had lost 8bps to 2.28%, while the French 10-year OAT yield had shed 9bps to 2.83%. The Italian 10-year BTP yield lost 4bps to 4.05% while the British 10-year gilt yield finished 10bps lower at 4.21%.
The AOFM held just the one bond tender this week; $700 million of April 2037s were priced at a nominal yield of 4.40%. There were also two Treasury note tenders which raised $2.0 billion on a short-term basis.
The gross value of all bonds issued by the AOFM in the 2023/2024 financial year (not taking into account buy-backs or short-term Treasury note tenders) is $24.60 billion. There are currently $847.45 billion of Treasury bonds and $40.586 billion of Treasury index-linked bonds on issue. The next series to mature does so on 21 April 2024 when $35.90 billion worth of bonds are due. There are also $30.00 billion of short-term Treasury notes outstanding.