
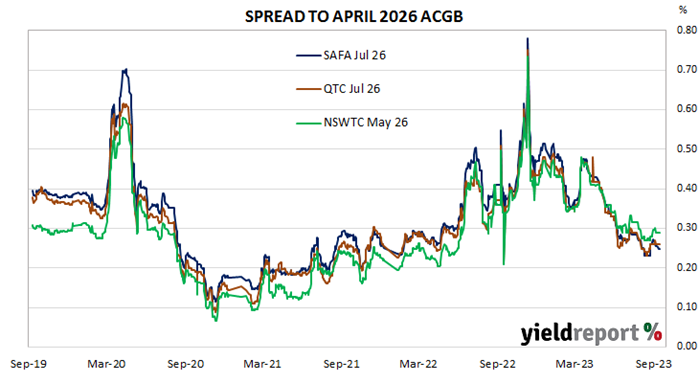
Summary: Semi-government bond spreads 1bp tighter.
Semi-government spreads finished the week about 1bp tighter on average as semi-government yields slightly lagged the rises of their Commonwealth Government counterparts. The majority of spreads in the sample varied within or quite close to a range from -2bps to 1bp and the exceptions were not particulary noteworthy.
AUSTRALIAN SEMI GOVT BONDS
| ISSUER | MATURITY | COUPON (%) | ISSUE SIZE | CLOSING YIELD | Δ WEEK | Δ MONTH | WEEK HIGH | WEEK LOW |
|---|---|---|---|---|---|---|---|---|
| WATC | 16-Oct-23 | 4.25 | 3,367 | 4.02 | 0.02 | -0.09 | 4.02 | 4.02 |
| SAFA | 20-Nov-23 | 6.00 | 1,520 | 4.04 | 0.01 | -0.09 | 4.04 | 4.03 |
| TCV | 21-Nov-23 | 1.00 | 1,122 | 4.10 | 0.01 | -0.05 | 4.10 | 4.09 |
| NSWTC | 8-Feb-24 | 5.25 | 4,542 | 4.24 | 0.11 | 0.04 | 4.24 | 4.14 |
| NTTC | 15-Mar-24 | 4.25 | 650 | 4.08 | 0.01 | -0.03 | 4.08 | 4.08 |
| QTC | 22-Jul-24 | 4.00 | 7,340 | 4.18 | 0.02 | -0.02 | 4.18 | 4.17 |
| WATC | 23-Jul-24 | 5.75 | 4,021 | 4.16 | 0.03 | -0.02 | 4.17 | 4.16 |
| SAFA | 15-Aug-24 | 2.50 | 2,128 | 4.13 | 0.02 | -0.06 | 4.13 | 4.12 |
| NSWTC | 20-Aug-24 | 2.25 | 4,324 | 4.17 | 0.02 | -0.04 | 4.17 | 4.16 |
| TCV | 17-Dec-24 | 5.00 | 5,055 | 4.16 | 0.02 | -0.01 | 4.16 | 4.15 |
| NSWTC | 20-Mar-25 | 5.25 | 2,100 | 4.19 | 0.03 | -0.01 | 4.21 | 4.19 |
| SAFA | 16-Apr-25 | 5.50 | 1,250 | 4.18 | 0.02 | -0.01 | 4.20 | 4.17 |
| ACTTREAS | 22-May-25 | 5.25 | 1,000 | 4.20 | 0.03 | -0.01 | 4.22 | 4.20 |
| QTC | 21-Jul-25 | 2.75 | 8,581 | 4.16 | 0.03 | -0.03 | 4.18 | 4.16 |
| WATC | 23-Jul-25 | 4.75 | 5,573 | 4.15 | 0.02 | -0.01 | 4.18 | 4.15 |
| TASCORP | 19-Feb-26 | 5.00 | 1,229 | 4.16 | 0.05 | -0.01 | 4.18 | 4.15 |
| NTTC | 15-Mar-26 | 3.25 | 650 | 4.17 | 0.05 | -0.02 | 4.19 | 4.17 |
| NSWTC | 20-May-26 | 6.00 | 5,473 | 4.12 | 0.05 | 0.01 | 4.14 | 4.11 |
| SAFA | 20-Jul-26 | 4.00 | 3,540 | 4.08 | 0.04 | 0.01 | 4.10 | 4.07 |
| QTC | 21-Jul-26 | 3.00 | 8,610 | 4.09 | 0.05 | 0.01 | 4.11 | 4.08 |
| WATC | 21-Oct-26 | 3.00 | 5,147 | 4.07 | 0.05 | 0.03 | 4.09 | 4.07 |
| TCV | 17-Nov-26 | 3.25 | 11,091 | 4.15 | 0.05 | 0.02 | 4.16 | 4.14 |
| NTTC | 21-Apr-27 | 5.50 | 600 | 4.12 | 0.04 | 0.00 | 4.14 | 4.12 |
| NSWTC | 20-May-27 | 2.75 | 9,961 | 4.10 | 0.05 | 0.03 | 4.12 | 4.10 |
| QTC | 20-Aug-27 | 3.00 | 8,794 | 4.09 | 0.04 | 0.03 | 4.11 | 4.09 |
| SAFA | 20-Sep-27 | 2.75 | 1,500 | 4.11 | 0.04 | 0.01 | 4.12 | 4.10 |
| WATC | 21-Oct-27 | 3.00 | 4,199 | 4.08 | 0.04 | 0.03 | 4.09 | 4.07 |
| NSWTC | 20-Mar-28 | 3.00 | 11,293 | 4.15 | 0.04 | 0.02 | 4.17 | 4.15 |
| SAFA | 24-May-28 | 3.00 | 4,040 | 4.15 | 0.04 | 0.00 | 4.18 | 4.15 |
| QTC | 21-Jul-28 | 3.25 | 8,520 | 4.13 | 0.04 | 0.01 | 4.15 | 4.13 |
| TCV | 20-Oct-28 | 3.00 | 11,194 | 4.20 | 0.03 | 0.00 | 4.23 | 4.20 |
| NSWTC | 20-Apr-29 | 3.00 | 10,233 | 4.23 | 0.03 | -0.01 | 4.27 | 4.23 |
| NTTC | 21-May-29 | 2.00 | 600 | 4.32 | 0.03 | -0.02 | 4.36 | 4.32 |
| ACTTREAS | 22-May-29 | 5.25 | 900 | 4.26 | 0.03 | -0.03 | 4.29 | 4.26 |
| WATC | 24-Jul-29 | 2.75 | 3,761 | 4.20 | 0.03 | -0.01 | 4.23 | 4.20 |
| QTC | 21-Aug-29 | 3.25 | 7,635 | 4.22 | 0.02 | -0.01 | 4.26 | 4.22 |
| TCV | 22-Oct-29 | 2.50 | 10,762 | 4.30 | 0.03 | -0.02 | 4.34 | 4.30 |
| NSWTC | 20-Feb-30 | 3.00 | 11,041 | 4.33 | 0.01 | -0.02 | 4.39 | 4.33 |
| NTTC | 21-May-30 | 2.00 | 750 | 4.49 | 0.02 | -0.02 | 4.54 | 4.49 |
| SAFA | 24-May-30 | 2.75 | 3,865 | 4.35 | 0.02 | -0.03 | 4.40 | 4.35 |
| QTC | 21-Aug-30 | 3.50 | 8,962 | 4.33 | 0.02 | -0.02 | 4.38 | 4.33 |
| TCV | 20-Nov-30 | 5.25 | 8,784 | 4.42 | 0.01 | -0.04 | 4.48 | 4.42 |
| NSWTC | 20-Mar-31 | 2.00 | 10,653 | 4.48 | 0.01 | -0.03 | 4.54 | 4.48 |
| NTTC | 21-Apr-31 | 5.25 | 750 | 4.61 | 0.01 | -0.01 | 4.67 | 4.61 |
| QTC | 21-Aug-31 | 1.75 | 7,357 | 4.46 | 0.02 | -0.02 | 4.51 | 4.46 |
| ACTTREAS | 23-Oct-31 | 5.25 | 1,000 | 4.53 | 0.02 | -0.03 | 4.59 | 4.53 |
| NSWTC | 20-Feb-32 | 2.00 | 13,827 | 4.62 | 0.00 | -0.04 | 4.69 | 4.62 |
| SAFA | 24-May-32 | 5.25 | 3,750 | 4.65 | 0.01 | -0.02 | 4.71 | 4.65 |
| TCV | 20-Dec-32 | 4.25 | 11,349 | 4.68 | 0.00 | -0.05 | 4.75 | 4.68 |
| NSWTC | 8-Mar-33 | 5.25 | 13,195 | 4.73 | 0.01 | -0.03 | 4.80 | 4.73 |
| QTC | 14-Mar-33 | 6.50 | 662 | 4.60 | 0.01 | -0.02 | 4.66 | 4.60 |
| NSWTC | 20-Mar-34 | 1.75 | 2 | 4.83 | 0.00 | -0.04 | 4.90 | 4.83 |
| QTC | 20-Jul-34 | 1.75 | 7,063 | 4.78 | 0.01 | -0.04 | 4.84 | 4.78 |
| WATC | 24-Oct-34 | 2.00 | 1,649 | 4.70 | 0.02 | -0.01 | 4.76 | 4.70 |
| QTC | 16-Apr-40 | 2.25 | 1,482 | 5.17 | 0.01 | -0.05 | 5.23 | 5.17 |
| NSWTC | 7-May-41 | 2.25 | 2,318 | 5.28 | 0.01 | -0.04 | 5.34 | 5.28 |
| QTC | 20-Nov-41 | 2.25 | 2,181 | 5.21 | 0.01 | -0.04 | 5.26 | 5.21 |