| Name | Price | Change | % Chg |
|---|---|---|---|
| Dow | 42,427.74 | -91.9 | -0.22% |
| S&P 500 | 5,970.81 | 0.44 | 0.01% |
| Nasdaq | 19,460.49 | 61.53 | 0.32% |
| VIX | 17.61 | -0.08 | -0.45% |
| Gold | 3,398.50 | -0.7 | -0.02% |
| Oil | 62.61 | -0.24 | -0.38% |
OVERVIEW OF THE US MARKET
US stocks pared an early advance but remained in the green Wednesday, as gains in tech shares offset weak economic figures. The S&P 500 Index rose 0.1%, with six out of the 11 sectors in the green.
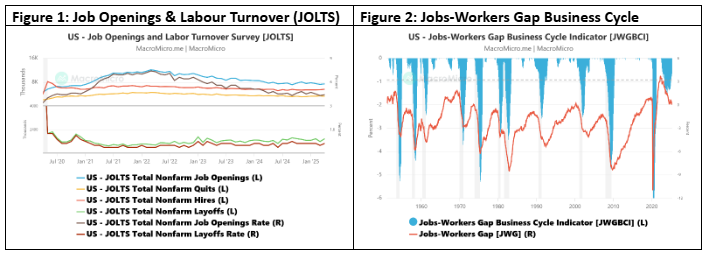
In terms of data, the JOLTS report showed a surprise increase in job openings for April, indicating continued strength in labour demand. US job openings rose in April to 7.39 million, driven by private-sector industries such as professional and business services and health care and social assistance. The advance in openings was accompanied by a pickup in hiring, which reached the highest level in nearly a year, despite a decline in openings in manufacturing and the leisure and hospitality sector. However, factory orders declined slightly more than expected. The JOLTS report tracks nonfarm job openings, voluntary quits, hiring, and layoffs. It is a key indicator often used by former Federal Reserve Chair Janet Yellen to assess the state of the U.S. job market.
In relation to Figure 2 below, the Jobs-Workers Gap (JWG) is calculated with the following formula:
(Household Survey Employment + JOLTS Job Openings – Household Survey Labor Force Participation) / Household Survey Labor Force Participation. Household Survey Employment and JOLTS Job Openings represent labour demand, while Household Survey Labor Force Participation represents labour supply. A high JWG ratio suggests strong demand in the labour market and a shortage of supply. While a lower JWG ratio indicates weak demand and oversupply in the labour market.
Meanwhile, Atlanta Fed President reiterated a cautious stance on interest rates, stating he’s in no rush to cut and wants to see “a lot” more progress on inflation. The Fed is expected to keep the fed funds rate steady once again this month. The rise in job openings helped reinforce the Federal Reserve’s assertion that the labour market is in a good place. While some economists fear a more notable weakening in coming months under the weight of tariffs, that hasn’t shown up in the data yet, supporting officials’ posture to keep rates steady.
.
OVERVIEW OF THE AUSTRALIAN MARKET
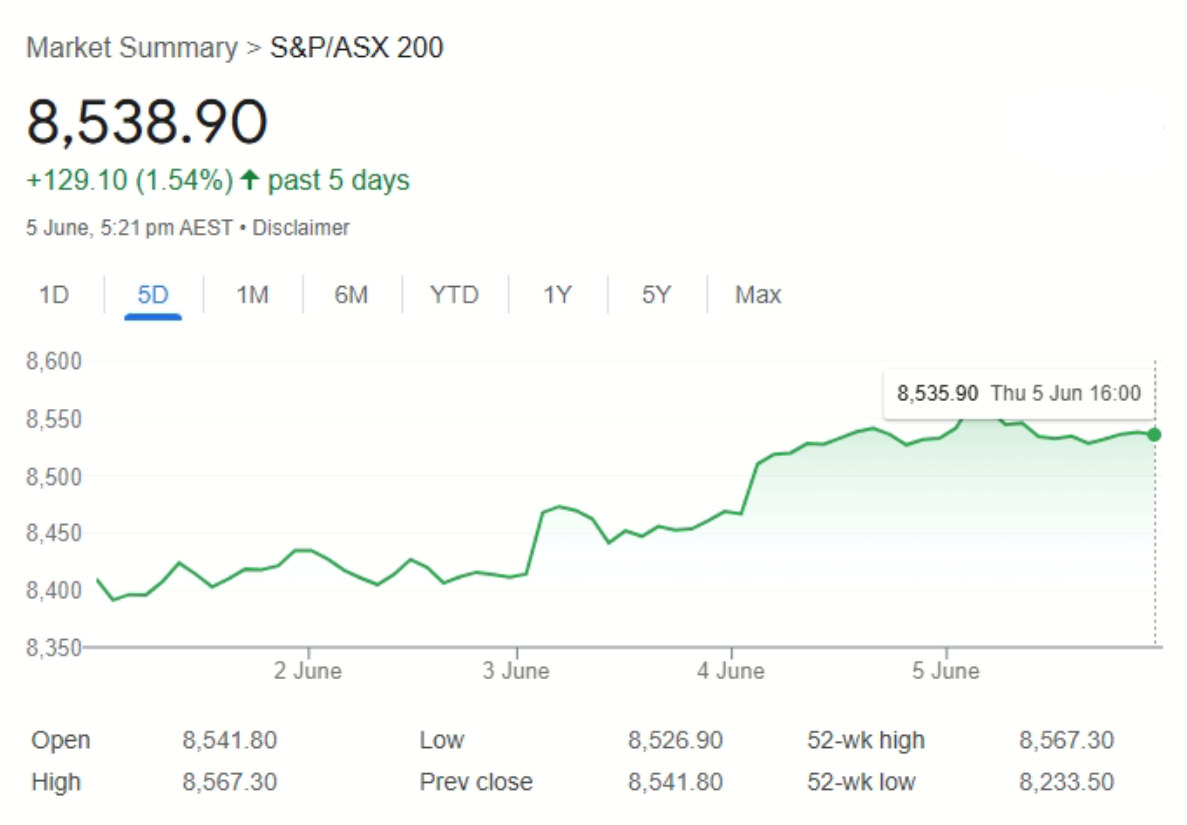
The S&P/ASX 200 Index climbed 0.8% on Wednesday. Australia’s economy grew 0.2% quarter-on-quarter in Q1 2025 while annual GDP rose 1.3%.
A Side Note on the USD
Meanwhile, Australian super funds need to focus in relation to their foreign currency exposure to help mitigate losses from Trump’s trade agenda. Australian super funds currently have an estimated $379 billion invested in overseas shares, of which around 20% is hedged against the US dollar. It used to be 35% a couple of years ago. Temporary phenomenon or a more permanent shift is really the question. Since April 2 the USD/AUD swing has been -10%, clearly adversely impacting US holdings unless hedged.
NAB forecasts the AUD to climb to US70¢ by year-end. Westpac estimates that a 10 percentage point increase in hedging ratios to 30% would add $100 billion in Australian dollar demand. If that happens over five years, the impact is not that much, but if it happens in 18 months, it’s a different story.
As we know May saw widespread gains against the dollar, with the USD falling below key technical levels across multiple pairs. The Taiwan Dollar’s 8.4% surge stood out, but strength was broad, fuelling speculation about a deliberate US devaluation—dubbed a potential “Mar-a-Lago Accord.” Yet today’s dollar plays a different role than during the Plaza Accord era: a large share of US assets is held by foreign investors, who would suffer from sustained dollar weakness, creating destabilizing feedback loops.
Preserving dollar hegemony outweighs trade deficit concerns. Major currency gains hurt foreign holders of US assets via portfolio losses, discouraging future dollar exposure. If the US signalled sustained depreciation, global demand for dollar assets would erode—undermining its financial dominance instead of improving trade balances.
Since April 2’s extreme reciprocal tariffs, the dollar experienced massive outflows creating a rare “triple kill” in stocks, currencies, and bonds. Trump’s renewed threats—50% EU tariffs starting June 1 and 25% on non-US iPhones—pushed the dollar back below 100 despite May agreements with the UK and China. This mirrors 2018-2019 trade war volatility, making short-term confidence restoration nearly impossible.
Combined net speculative long positions in the dollar and euro hedges have collapsed to early 2024 levels, with the dollar twice breaching the critical 100-level since April. Asian rush exports in H1 further pressure dollar demand while market positioning data reveals underlying sentiment remains structurally damaged by policy uncertainty.
Unlike 1985’s Plaza Accord, current dollar holdings are highly diversified, requiring Chinese cooperation despite reduced US export reliance and strategic competitor status. China’s PBOC maintains RMB weakness
intentionally, making active collaboration with US dollar depreciation virtually impossible—eliminating the critical partner needed for coordinated intervention.
Deliberate dollar depreciation would reduce overseas willingness to hold dollar assets, undermining America’s fundamental advantage—dollar hegemony. This strategic imperative explains why policy-driven depreciation remains unviable, as maintaining reserve currency status takes priority over trade balance improvements, supporting H2 dollar stabilization expectations.
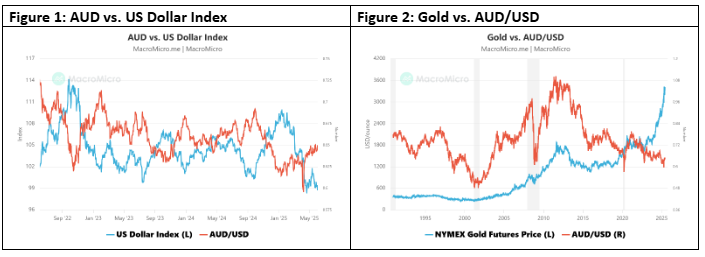
In relation to Figure 2 below, Australia is the 2nd largest producer of gold and the 6th exporter of gold. Gold accounts for 6% of Australia’s overall exports. Historically, AUD and gold price have a correlation coefficient of 0.77 which shows high correlation.