
| Name | Daily Close | Daily Change | Daily Change (%) |
|---|---|---|---|
| Dow | 42,762.87 | 443.13 | 1.05% |
| S&P 500 | 6,000.36 | 61.06 | 1.03% |
| Nasdaq | 19,529.95 | 231.5 | 1.20% |
| VIX | 16.77 | -1.71 | -9.25% |
| Gold | 3,331.00 | -44.1 | -1.31% |
| Oil | 64.77 | 1.4 | 2.21% |
OVERVIEW OF THE US MARKET
Stocks closed at their highest since February and bond yields rose as jobs data allayed concerns of an imminent economic slowdown. Equities also gained amid hopes US-China trade tensions are easing, with Trump saying negotiators will talk Monday. A 1% advance in the S&P 500 drove the gauge to the 6,000 mark. All major industries climbed. Tesla Inc. jumped over 3.5% to lead megacaps higher. Treasuries dropped across the curve, with two-year yields topping 4%. Money markets trimmed bets that the Federal Reserve will cut interest rates this year.
US job growth moderated in May and the prior months were revised lower, indicating employers are cautious about growth prospects as they weigh the Trump administration’s economic policy. Nonfarm payrolls increased 139,000 last month after a combined 95,000 in downward revisions to the prior two months. The unemployment rate held at 4.2%, while wage growth accelerated. Employers have been ‘hoarding labour’ in the face of massive corrosive uncertainty. It costs money to fire workers, and we believe firms have been reluctant to lay off workers until they saw the extent of the Trump tariffs. Lessons were learnt during Covid. But dig deeper.
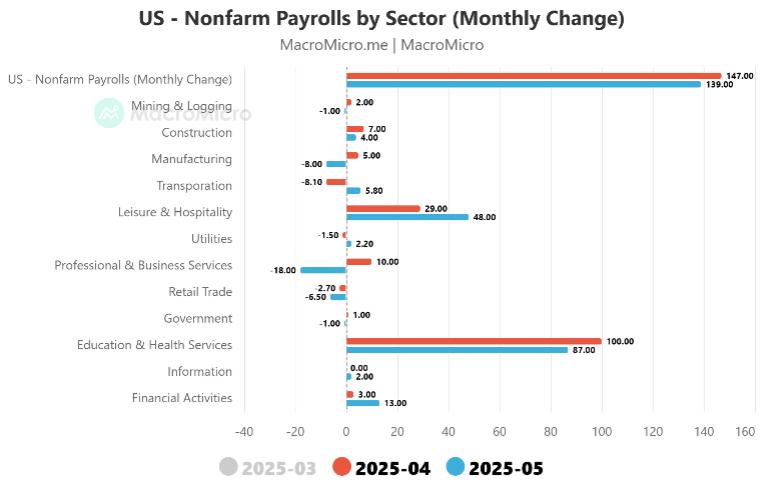
Cracks in the façade of labour market resilience are now starting to show and the longer the tariff uncertainty and government spending cuts continue the worse the labour market reports are bound to be. The advance in payrolls reflected strength at service providers, including health care and social assistance as well as leisure and hospitality (see Figure 2). The latter is a seasonal market, so the read we’d say is not as solid as it may have appeared at a headline level. On that front, industries that are more exposed to tariffs flashed warning signs. Manufacturing payrolls dropped 8,000 last month, the most this year, while employment growth in transportation and warehousing rose slightly after declining in each of the prior two months. Employment at temporary-help agencies fell by the most since October.
Furthermore, the household survey, showed a 254,000 increase in the number of people who went from employed to out of work during the month. That was the biggest rise since the start of 2022. Another major question for economists and policymakers is the extent to which Trump’s efforts to cut back on government spending will take a toll on employment. The federal government shed 22,000 jobs in May, the most since 2020. Economists contend that at least half a million US jobs could be on the line as federal spending cuts spread to contractors, universities and others who rely on public funding.
Cracks in employment and wage growth – the Fed remains very much ‘wait and see’. Forget about Trump’s exhortation for a 100 bps cut – they are not even thinking 25 bps currently. And indeed that is what the markets are reflecting. Interest-rate swaps showed traders now see a roughly 70% chance of a 25 bps rate cut by September, compared with a probability of about 90% on Thursday. The amount of easing priced in for the year declined to about 43 bps, fewer than two quarter-point cuts.
Figure 1: US Nonfarm Payrolls (of May 2025)
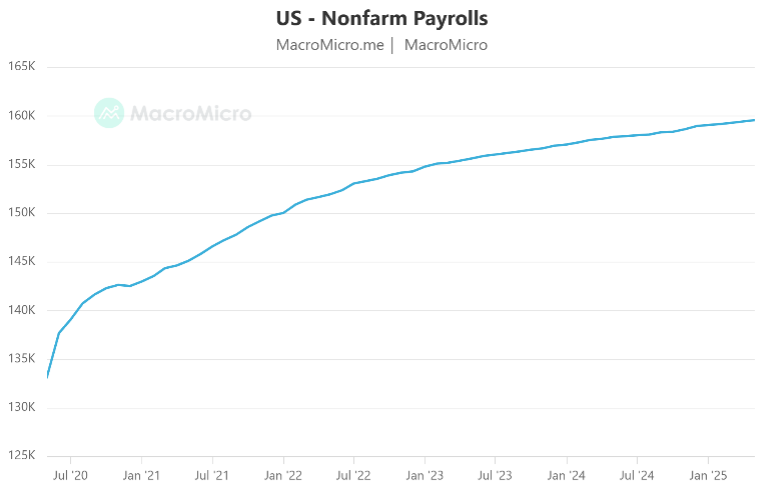
Figure 2: US Nonfarm Payrolls by Sector (May ’25)
OVERVIEW OF THE AUSTRALIAN MARKET
On Friday, the S&P/ASX 200 fell 0.3% with eight of the 11 sectors in the red. Still, the bourse notched a 1 per cent gain over the week. The All Ordinaries edged down 0.3%. But for the week, the ASX recorded its fourth consecutive weekly gain. If there was a positive yesterday, then it related that Trump said he would resume trade talks with Chinese President Xi Jinping, which helped soothe concerns about the global trade war. That said, no concrete details were provided. Analysts noted that despite the renewed dialogue, tensions remain elevated and risks of further escalation persist amid limited substantive progress.
Among the miners, BHP rose 0.7% and Fortescue rallied 1%. The rise in the mining giant’s share price tracked the higher iron ore price. Futures in Singapore were up 0.8% to $95.65 a tonne. Critical minerals stocks were heavily sold on expectations China could ease export restrictions on rare earths. Pilbara Minerals slumped 5.2% and IGO lost 3.5%.
Wider losses swept across the ASX 200 as investors took money off the table ahead of the latest US monthly jobs report that will fan speculation about the Fed’s next round of interest rate cuts. Profit-taking in technology and the bank stocks gathered momentum, with index heavyweight CBA retreating 0.8%.
Meanwhile, the AFR ran an interesting article on the weekend, and on a topic we are all too familiar with. The ASX is dominated by 5 banks. As was noted, it’s a stark contrast to the US sharemarket, where innovative technology companies take out the top seven positions: Nvidia, Microsoft, Apple, Amazon, Alphabet, Meta and Broadcom. Productivity is booming in the tech-savvy US. See Figure 1.
While healthy banks are a positive, bank profits are earned from lending to a relatively unproductive asset class: residential property. The national obsession with loading up on debt to build wealth from property is likely contributing to stagnant productivity, a lack of business dynamism and failure to produce more world-leading businesses.
And there is a bigger problem. A growing pool of either actually contrained or home country biased ‘constrained’ money chasing a decreasing pool of ASX stocks (there’s a lack of ASX equitisation). CBA is the poster child. The valuation metrics on a company with subdued profit growth is staggering. CBA is trading at circa 31 times and well above the 16.5 times long-term average. The tech giants like Nvidia, Microsoft, Meta, Apple and Google have carried international sharemarkets to prosperity by growing their profits at double-digit rates. But as we sit here today, CBA’s 31 times valuation is on par with some of the so-called magnificent seven tech giants, namely Apple and Meta, but below that of Microsoft, Amazon and Nvidia. And all those stocks are both Growth and Defensive – they have massive Moats and throw off huge amounts of cash.
Regarding Figure 2, well, the upside is the ASX has less Beta than the US markets, and that typically translates into a lower drawdown profile.
-
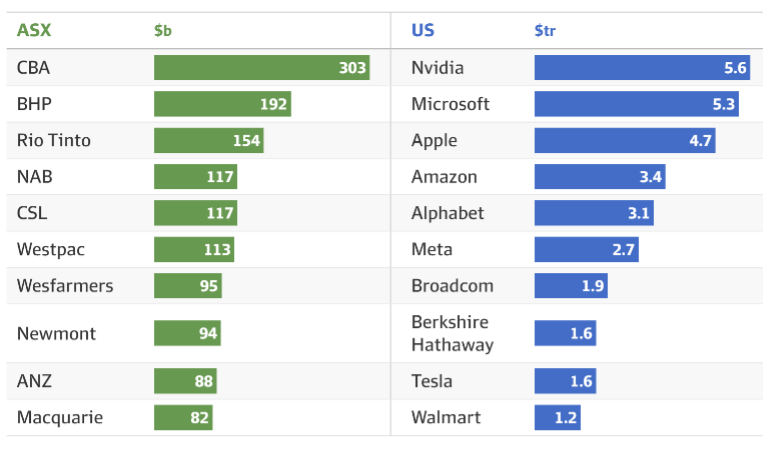
- Figure 1: Top 10 Companies by Mkt Capitalisation

-
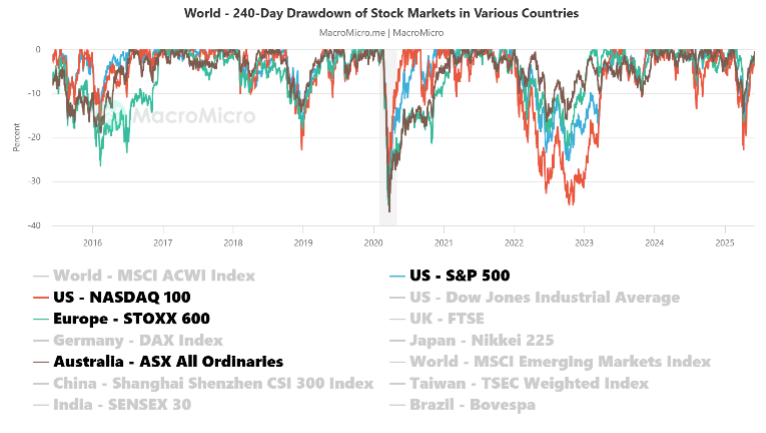
- Figure 2: Drawdowns of Select Global Stock Mkts

Meanwhile, the Australian dollar recorded a 1% gain during the week after renewed weakness in the greenback overnight helped boost the local currency. The dollar held just above US65¢ on Friday afternoon after earlier hitting US65.37¢ – a six-month high.