
Retail Sales Overview
The latest US retail sales data for July 2025 indicates modest growth, with total sales increasing by 0.6% month-over-month and 3.9% year-over-year, reaching $720.1 billion. Excluding motor vehicles and parts, sales remained flat, while excluding both motor vehicles and gasoline, they declined by 0.3% when adjusted for inflation.
Notably, non-store retailers, which encompass e-commerce platforms, experienced an 8.0% year-over-year growth, highlighting the ongoing shift towards online shopping. Conversely, food service and drinking places saw a 5.6% increase, reflecting sustained consumer demand for dining experiences.
Despite these gains, there are concerns about the sustainability of consumer spending. The National Retail Federation projects a slowdown in retail sales growth for 2025, estimating an increase between 2.7% and 3.7%, down from 3.6% in 2024. Factors contributing to this moderation include potential rises in unemployment, declining income levels, and inflation driven by tariffs.
Overall, while July’s retail sales data reflects positive consumer activity, the anticipated challenges in the latter half of 2025 suggest a cautious outlook for the retail sector.
Core Group Performance
The retail sales control group, which excludes more volatile categories, rose by 0.5% , surpassing the expected 0.4% but lower than the previous 0.77%. On a basis, this group saw a 4.8% increase, up from 4.47% previously.
Components Details
Motor Vehicle sales grew by 4.66%, down from 6.62%. Sporting Goods saw a rise to 2.34% from a previous -0.14%. Building Material & Garden Equipment sales declined by 2.56%, a larger drop from -0.3%. Electronics Appliance sales decreased by 2.27%, down from -0.64%. Furniture sales increased to 5.09% from 4.54%. Gasoline Station sales fell by 2.89%, slightly better than the previous 3.39%. Nonstore Retailers saw a significant increase to 8.01% from 5.2%. Food & Drinking Services sales growth slowed to 5.58% from 6.73%.
Retailer Inventory
U.S. retail inventories rose to $808.4 billion in June 2025, up from $804.5 billion in May, highlighting sector-specific dynamics shaped by consumer behaviour and macroeconomic trends. Inventory growth at the retail level is crucial, as excess stocks without matching demand can trigger a destocking cycle across manufacturing. Key sectors dominate total inventories: motor vehicles and parts (23–28%), general merchandise stores (13–14%), and building materials and gardening supplies (10–11%). Other notable categories include food and beverages (8–9%), clothing (7–8%), and furniture, electronics, and appliances (4–5%). Year-over-year growth rates are closely tracked to filter out seasonal fluctuations.
The Details
Retail sales can be divided into two categories: durable goods (35%) and non-durable goods (65%). Main items of retail sales include:
- Motor vehicles (20~22%)
- Food and beverages (10~15%)
- General merchandise (10~13%)
- Food and drinking services (11~12%)
- E-commerce (9~11%)
- Gas stations (8~10%)
Car sales account for the highest proportion of retail sales and thus are a key indicator of economic activity in the U.S. In addition, e-commerce is also an item to watch as it has grown rapidly in recent years in terms of both proportion and sales volume.
Exhibit 1 shows the monthly growth rates across the different components. Motor vehicles, furniture and sporting goods stand out on the positive growth side, while Electronics, Building Materials and Food & Drinking services were outliers on the negative growth side.
Exhibit 1 – US Retail Sales by Component – Monthly Growth
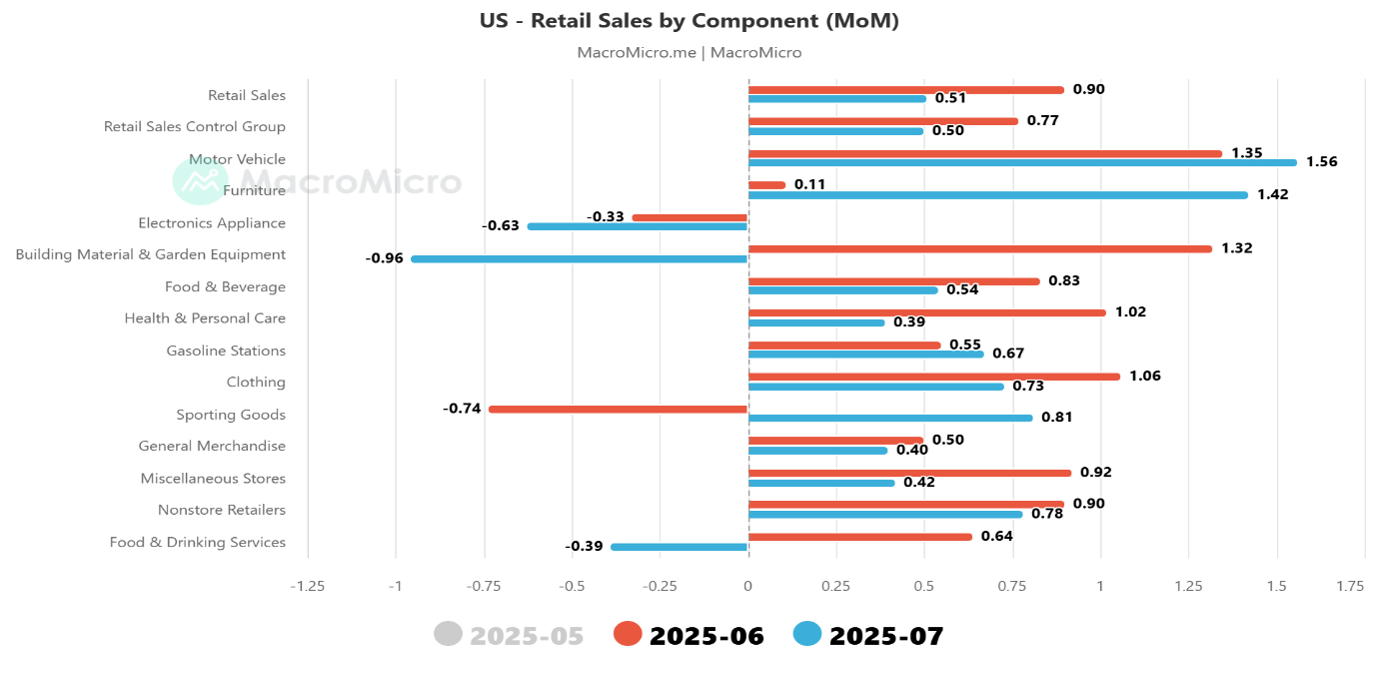
Exhibit 2 provides the detailed year-on-year growth rate for each component. The headline growth of 3.92% was lower than the 4.35% recorded last month. Sporting Goods, Furniture and Non-store retailers stood out on the positive side, while Building Materials, Electronics and Gasoline stations stood out on the negative side.
Exhibit 2 – US Retail Sales by Component – YoY Growth
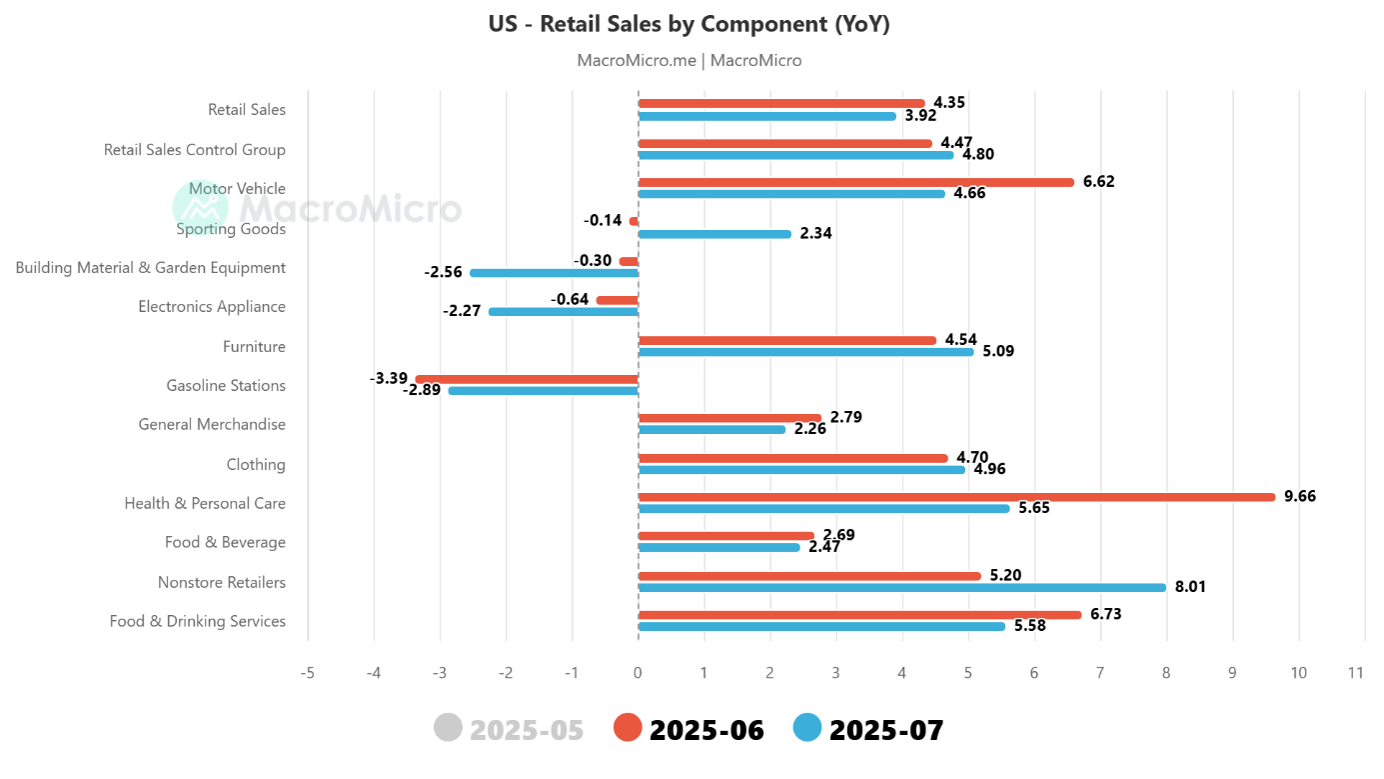
Exhibit 3 – US Retailer Inventory by Sector
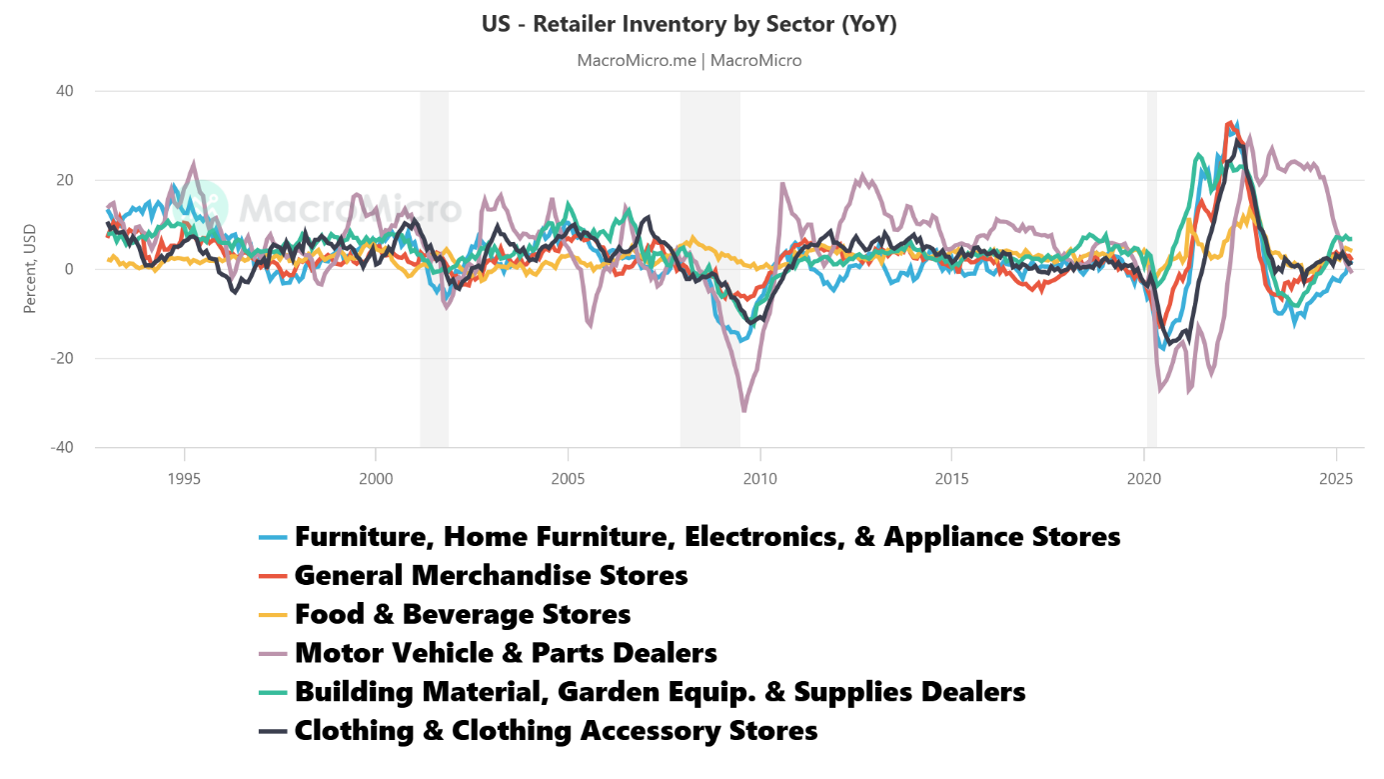
The annual growth rate of retailer inventories in the U.S. reflects the status of downstream inventory in the supply chain. When growth of inventories at the downstream retail end increases without enough consumption support, excess inventories may transmit from the downstream up across the manufacturing industry, triggering a destocking phase. Among different sectors, automobiles, general merchandise stores, and construction and gardening account for a high proportion of total inventories, making them crucial for monitoring inventory levels on the retail end.
The latest data reveals sector-specific trends influenced by shifting consumer behaviour and macroeconomic factors.
Sector Performance:
Automotive: Inventory levels remain high, reflecting ongoing supply chain adjustments and consumer demand fluctuations. General Merchandise: Continued inventory accumulation suggests cautious optimism, though growth may be slowing. Construction and Gardening: Elevated inventories indicate a shift towards home improvement as consumers focus on enhancing existing assets.
Apparel and Luxury Goods: Experiencing inventory challenges due to reduced discretionary spending and changing fashion cycles. Consumer Behaviour: There’s a noticeable shift towards value-oriented and essential discretionary items, with consumers becoming more intentional and channel-agnostic in their purchasing decisions.
These insights suggest that while certain sectors face challenges, others are adapting to meet evolving consumer preferences. Retailers may need to recalibrate strategies to align with these sector-specific dynamics.